With the release of OBIEE 11.1.1.6, mapviewer comes pre-configured with weblogic and the only installation steps required are:
You do not have to modify any weblogic XML files, install any mapviewer jar files, or do any configuration within weblogic. Below is a step by step guide on how to configure and use mapviewer on your 11.1.1.6.x box:
Step 1: Download the mapviewer 'mvdemo' data into your Oracle database
Oracle provides pre-configured maps, coordinates, and navteq data that use can use in your reports. You need to download the MVDemo Sample Data Set .
Step 2: Create the mvdemo schema in your Oracle database
We're going to import the navteq map data into an mvdemo schema in step 3. Let's go ahead and create the mvdemo schema by typing the following command into your SQLPlus prompt:
grant connect, resource, create view to mvdemo identified by mvdemo
Note that you will need the appropriate privileges to create this account. If denied, try logging in as sysdba by typing the following command into sqplus:
CONNECT / AS sysdba
Step 3: Import navteq data dump to your Oracle database
Unzip the MV Demo Sample Data Set you just downloaded, and note the location of the 'mvdemp.dmp' file. This is the file we will import to the database.
Step 3.1)
Find the imp utility on your machine. It is usually located in your $ORACLE_HOME\product\11.x.x\dbhome_1\BIN folder
Step 3.2) Navigate to that folder via command line and run the following command:
imp mvdemo/mvdemo@ORCL file=mvdemo.dmp full=y ignore=y
where ORCL is your database SID
and file=mvdemo.dmp is the path (including mvdemo.dmp) to the dump file
You should get the following result:

Step 4) Import the map meta data
The Map Viewer Sample Data Set comes with city, county, state, highway, and other geographical map based data that you can impose onto the map. We're going to import this data set by running the following command in sqlplus:
:
@mvdemo.sql
Note that you must include the path of the mvdemo.sql file e.g. @C:\folder\folder1\mvdemo\mvdemo.sql
Step 5) Add your Oracle Database as a MapViewer Data Source
No, we're not doing this in weblogic - Mapviewer data source configuration is still done in yourhttp://localhost:9704/mapviewer location
You'll arrive at a landing page like below, where you must click the 'Admin' button to log in:

5.1) login user your weblogic username/password
5.2) You should arrive at a home page with a link to view Datasources. Click it and you'll appear at:


- installation of navteq mapdata to your oracle database
- establish a column based relationship between the map and a subject area
You do not have to modify any weblogic XML files, install any mapviewer jar files, or do any configuration within weblogic. Below is a step by step guide on how to configure and use mapviewer on your 11.1.1.6.x box:
Step 1: Download the mapviewer 'mvdemo' data into your Oracle database
Oracle provides pre-configured maps, coordinates, and navteq data that use can use in your reports. You need to download the MVDemo Sample Data Set .
Step 2: Create the mvdemo schema in your Oracle database
We're going to import the navteq map data into an mvdemo schema in step 3. Let's go ahead and create the mvdemo schema by typing the following command into your SQLPlus prompt:
grant connect, resource, create view to mvdemo identified by mvdemo
Note that you will need the appropriate privileges to create this account. If denied, try logging in as sysdba by typing the following command into sqplus:
CONNECT / AS sysdba
Step 3: Import navteq data dump to your Oracle database
Unzip the MV Demo Sample Data Set you just downloaded, and note the location of the 'mvdemp.dmp' file. This is the file we will import to the database.
Step 3.1)
Find the imp utility on your machine. It is usually located in your $ORACLE_HOME\product\11.x.x\dbhome_1\BIN folder
Step 3.2) Navigate to that folder via command line and run the following command:
imp mvdemo/mvdemo@ORCL file=mvdemo.dmp full=y ignore=y
where ORCL is your database SID
and file=mvdemo.dmp is the path (including mvdemo.dmp) to the dump file
You should get the following result:

Step 4) Import the map meta data
The Map Viewer Sample Data Set comes with city, county, state, highway, and other geographical map based data that you can impose onto the map. We're going to import this data set by running the following command in sqlplus:
:
@mvdemo.sql
Note that you must include the path of the mvdemo.sql file e.g. @C:\folder\folder1\mvdemo\mvdemo.sql
Step 5) Add your Oracle Database as a MapViewer Data Source
No, we're not doing this in weblogic - Mapviewer data source configuration is still done in yourhttp://localhost:9704/mapviewer location
You'll arrive at a landing page like below, where you must click the 'Admin' button to log in:

5.1) login user your weblogic username/password
5.2) You should arrive at a home page with a link to view Datasources. Click it and you'll appear at:
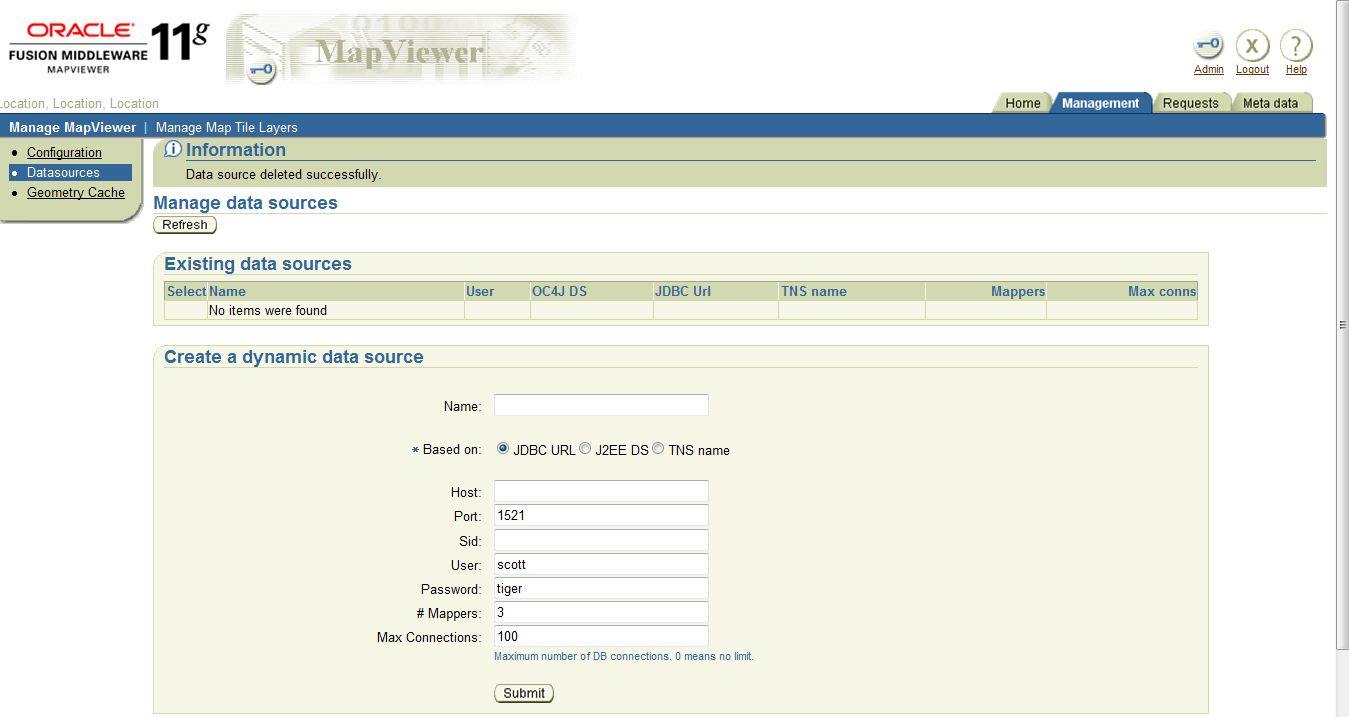
Name = name/description of your data source
Host = hostname/ip address of your database
Port = database port number
SID = service ID of your oracle database (by default it is orcl)
user/password: If you followed my above steps, it will be mvdemo/mvdemo
# Mappers and Max Connections specify how many simultaneous users can connect to the MapViewer db. For diagnostic purposes I would make this relatively high, and once development is complete you can adjust as needed.
Step 6) Modify the mapViewerConfig.xml file to include the new data source
I'm a little surprised as to why this must be done manually, if anyone has any insight - please feel free to leave feedback. After you add the data source as outlined in step 5, you must then modify the mapViewerConfig.XML file to include said datasource, otherwise when the BI Server is rebooted, your datasource connection will be removed!
Luckily, this step is not too difficult
6.1) In :7001/mapviewer , log into your Admin screen and navigate to Management -> Configuration
Then add the following XML to the bottom of the config file, right above the </MappperConfig> line.

<map_data_source name="mvdemo"
jdbc_host="db1.my_corp.com"
jdbc_sid="orcl"
jdbc_port="1521"
jdbc_user="scott"
jdbc_password="!tiger"
jdbc_mode="thin"
number_of_mappers="3"
allow_jdbc_theme_based_foi="false"
/>
Modify each line using the inputs you provided in step 5, but in the jdbc_password input should have a ! infront of it as that is Oracle's indicator to encrypt the password upon restart.
Step 7) Import a map layer into Answers
We've completed all of the back end work required to create a map. Now we'll go into Answers -> Administration -> Manage Map Data and import a layer (theme) that we'll use for our map.
A theme is a visual representation representation of the data, and arguably the most important component in creating a map. In this example let's use the "THEME_DEMO_COUNTIES" layer, which will give us the ability to impose a dataset over various Counties in the USA.

Step 8) Specify the BI Column used to associate the THEME_DEMO_COUNTIES layer to a dataset
The theme we're using, "THEME_DEMO_COUNTIES" stores attributes of Counties (county name, county lines, etc) which we can visualize on a map. We need to identify a way to 'join' the data set in OBIEE to the dataset of THEME_DEMO_COUNTIES.
After saving the layer you just created, click the 'Edit' button (pencil) to bring up the screen below.

Notice there is 'Layer Key' with the following column values; County, Fips, Population, State. We are going to use 'County' as the map column to join to the subject area.
Next we need to specify a column from our subject area which contains 'County'.
Step 9) Specify the Background Map
In steps 7 and 8 we specified a theme (visual representation of the data) and identified how to join the map data to our subject area (via County column). Now we need to specify which map we're the theme will use.
In the 'Background' tab, create a new background map and specify 'DEMO_MAP' as the background map.

After saving, edit the map ensure the THEME_DEMO_COUNTIES has successfully been applied:
It will default to the middle of the USA but I decided to zoom into California :)

Step 10) Create a Report using the County Column
Now we're ready to create the report! Create a new analysis, select the County column you specified in step 7, and a fact column which joins to the county dimension. Click the results tab, then New View -> Maps.
The result below outlines only California because the dataset I created uses only California Counties.
