Overview
The Getting Started with Oracle BI Publisher OBE covered the regular features such as creating reports from various data sources, and also creating templates by using BI Publisher Desktop in MS Word. Oracle BI Publisher can also create Master Detail Reports, create reports from multiple data sources, burst the reports to a file location, and so on. This course provides step-by-step procedures to explore these advanced features of Oracle BI Publisher.
Scenario
Please download the folder provided with this OBE : My Templates and Files. You will use these files in the examples.
You will be using some of the reports that are similar to the ones you created in the OBE "Getting Started with Oracle Business Intelligence Publisher". These reports are provided to you in the My Templates and Files folder.
It is recommended that you should have completed the OBE mentioned above, installed the required software, and performed the other setup tasks listed in the "Prerequisites" topic. The assumption throughout this course is that you are familiar with the basic user interface and navigation of the Oracle BI Publisher.
It is recommended that you should have completed the OBE mentioned above, installed the required software, and performed the other setup tasks listed in the "Prerequisites" topic. The assumption throughout this course is that you are familiar with the basic user interface and navigation of the Oracle BI Publisher.
Prerequisites
To complete this tutorial, you should:
- Make sure Oracle BI EE 11g is installed
- Have access to or have installed Oracle Database 11g with database sample schema, such as OE
- Have access to the BISAMPLE schema that is included with the Sample Application for Oracle Business Intelligence Suite Enterprise Edition Plus. There are three options for accessing the BISAMPLE schema:
- If you have already installed version 825 or V107 of the Sample Application, verify that you have access to the BISAMPLE schema and begin the tutorial.
- If you are interested in downloading and installing the complete Sample Application, you can access it here on the Oracle Technical Network (OTN). Please note, however, that only the BISAMPLE schema is required to complete this tutorial. If you want to install only the BISAMPLE schema, proceed to option 3.
- Click here to access the ForOBE.7z file, which has the 825 version of the BISAMPLE schema and installation instructions. Save ForOBE.7z, unzip, and begin with README FIRST.txt.
- Have "demo" and "BISAMPLE" data sources configured. This is covered in "Configuring the Data Sources" in the Getting Started with Oracle BI Publisher OBE.
- Create a Learn folder under My Folders if you don't have one.
- Create a BIP folder in your local drive D. If the local drive is named differently, then take care while creating the bursting query. This folder is used to deliver the report to burst to a file location.
- Download and unzip the file My Templates and Folders.zip available with this OBE.
Software Requirements
The following is a list of software requirements:
- Oracle BI EE 11.1.5 or later must be installed.
- Oracle Database 11.x version must be installed.
- Microsoft Office 2003 or later must be installed.
Creating a Master Detail Report (Creating Detailed Summary Reports)
In this topic, you will see a Oracle BI Publisher report having master-detail (parent-child) relationships between two data sets. The topic covers an example that demonstrates creating a new report with the readily available Data Model, which has two data sets: Customers and Orders. This data link (parent-child relationship) relates the results of multiple queries. This topic covers an example demonstrating the summarized details. This type of report is called a Master Details report or Summary Details report. You will also use an existing boilerplate template that already includes the required layout grid components (for example, Report Header/Footer, Name & Address sections, Chart & Table sections).
You will create a new report with the existing Data Model, and use the boilerplate template.
Creating a Master Detail Report
This example uses the Data Model Adv OBE - Order Entry.xdm. This topic will cover examining the data sets used by the Data Model, the parameters defined, and then creating a new report with a layout that is suitable for interactivity. You will create a Master Detail Report similar to the one shown below. This screenshot is edited to show you a flowing view of the entire report. This report uses a Data Model that connects Customers and Orders data, and links them together to get the detailed report.

In this example, you will:
- Examine the Data Model (Adv OBE - Order Entry) that is used to create the report
- Create a Master Detail Report by using the Data Model Adv OBE - Order Entry
- Use the boilerplate template to provide flexible layout for the report
| 1 . | Log in to the OBIEE (http://<host>:<port>/analytics) |
|---|---|
| 2 . | Click New>>Report on the global header. |
| 3 . | The Choose Existing Data Model dialog box appears. Navigate to the directory My Folders\Learn, and selectAdv OBE - Order Entry Data Model. (This Data Model is available in the My Templates and Files folder. You will need to upload this Data Model to the Learn folder.)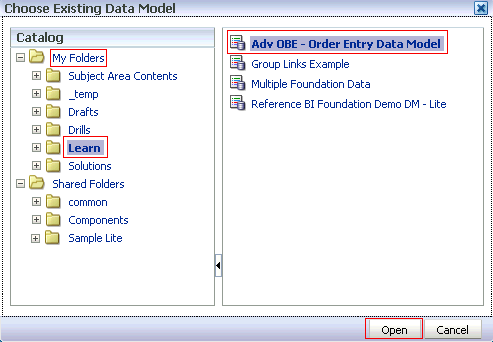 Click Open. |
| 4 . | The report editor appears when the Adv OBE-Order Entry Data Model is chosen. Observe that the report is displayed as Untitled, because you are yet to save the report.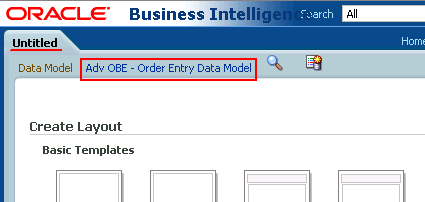 a. Click Save. Navigate to the Learn folder and enter Advanced OBE Master Detail Report in the Name text box. Create a Learn folder if you don't have one.  b. Click Save. This will take you back to the report editor. |
| 5 . | In the report editor window, click Adv OBE - Order Entry Data Model to examine the structure of the Data Model, its data sets, and parameters. Take a closer look at each of the features of the Data Model to understand the master-detail relationship/structure in the data. Also, examine the relationship between the parameters and binding variables in the SQL queries and the cascading LOVs. This example will demonstrate these sections. |
| 6 . | In the Data Model editor, the Data Model is displayed with the defined data sets, list of values, and the parameters. You will take a closer look at each of these in the following steps. Observe that the Default Data Source for the Data Model is demo. Note: If your data set is not set properly, (in this example it is demo), you might get an error while viewing the report. Please refer to the Getting Started OBE to set the demo data source for JDBC. This is one of the prerequisites for this OBE.  . |
| 7 . | Click Data Sets>>Orders to observe the defined XML data set, its structure, and the contents. The example shows the data set as Orders (SQL type).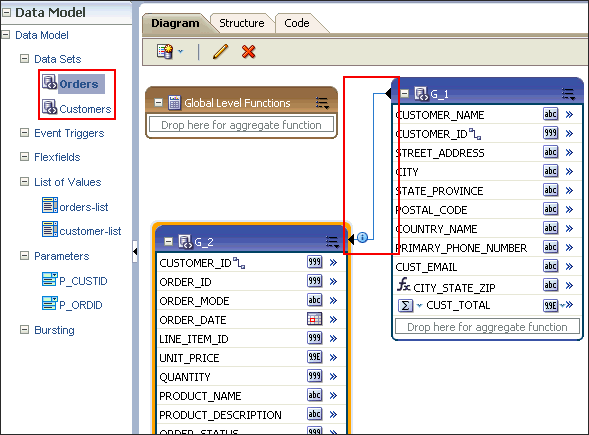 If you place your curser over the link highlighted in the screenshot above, it will display the element link or join between the two data sets Orders and Customers.  |
| 8 . | The Element by Expression feature in the Data Model enables you to create complex elements in the report. In this example, you can see that a "CITY, STATE, and ZIP" element is created by combining the data for City, State, and Zip. This feature will give more flexibility to your report. a. In the Data Model editor, select the data set G_1. b. Select the CITY_STATE_ZIP element and click the Actions menu. c. Select the Properties option to open the Expression Editor dialog box. Because this Data Model is a predesigned one, you will examine the properties for an existing/available element.  If you are creating an element by expression, you will need to select the "Create Element by Expression" option in the Actions menu for the data set. This will take you to the Add Element Editor dialog box for the selected data set (in this example, G_1) window. 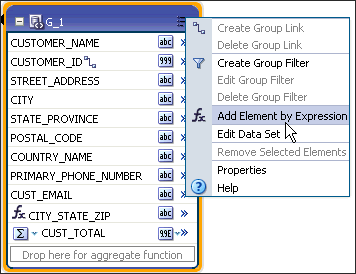 d. In the element editor, examine the relevant Name, Display Name, and Data Type. Observe that the following Expression is stated: CITY_STATE_ZIP = concat(concat(concat(G_1.CITY,', '), concat(G_1.STATE_PROVINCE,', ')),G_1.POSTAL_CODE 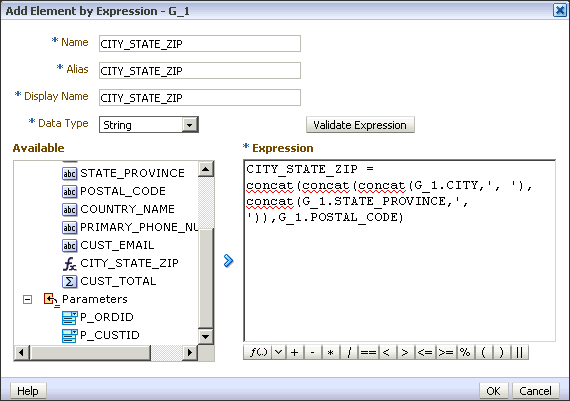 e. Click OK. Similarly, you can use these Element by Expression features to combine various other data to create complex data items in the report. You will see a few more examples of this in the following steps regarding order details. |
| 9 . | You can use the Data Model editor to aggregate data at the group or report level. Check the properties for the element Line_TOTAL in the Edit Properties window.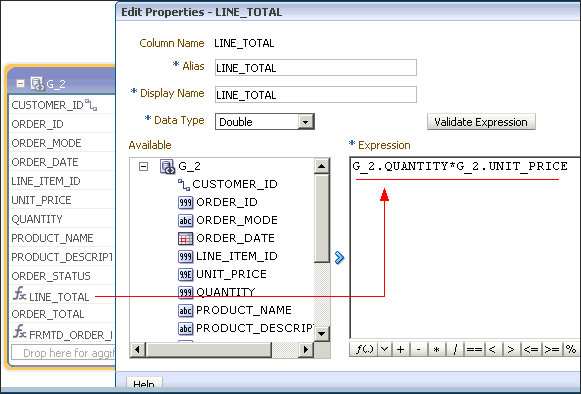 This aggregate function is also used to create CUST_TOTAL in the Customers data set. This is done by draggingLINE_TOTAL from the Orders data set to the "Drop here for aggregate function" in the Customers data set. Observe that the the item CUST_TOTAL has Summary as the function. The Expression is: LINE_TOTAL = PRICE*QUANTITY.  Here are a few examples that illustrate the power and flexibility that the Data Model editor provides. |
| 10 . | Click List of Values. Observe the available orders-list and customer-list. |
| 11 . | a. Examine the parameters that are defined in the Data Model.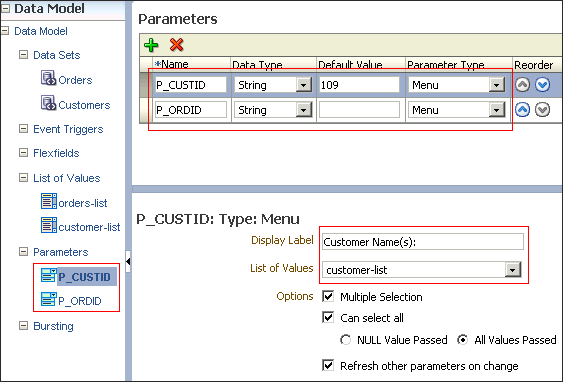 b. Click Return to get back to the report editor. |
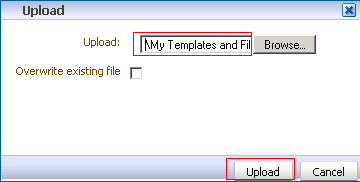
| 12 . | In the report editor, select Customer Orders > boilerplate template. This will open the layout editor window with the selected template.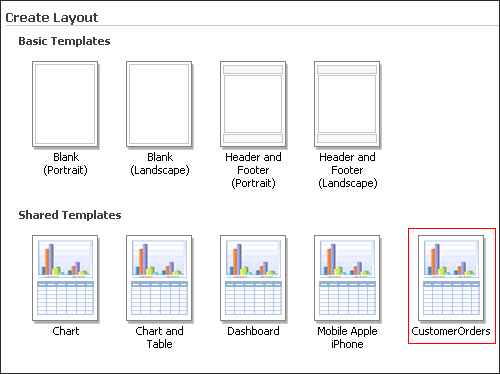 Note: This template is provided to you in the My Templates and Files folder. Please upload this template to your server as well. (File name: Boilerplates.xdoz) To upload the boilerplate template:

 Click Upload.
 This template is available to you in the report editor window, when you have to choose or define a layout for your report. In this example, the boilerplate template is Customer Orders. |
| 13 . | In the layout editor window, the report is displayed with the Customer Orders boilerplate template. Select the Title grid, and change the title of the report to Customer Orders Summary Report. Note: Highlight the existing text for the title in the template, and type over it. The title format is maintained.  |
| 14 . | The template has a repeating section for Customer Name. This is to display orders for more than just one user (i.e., to allow for All and to multi-select for the Customer Name parameter). The layout grid for Customer Name is included in the repeating section so that the report can display the customer orders under each customer's name.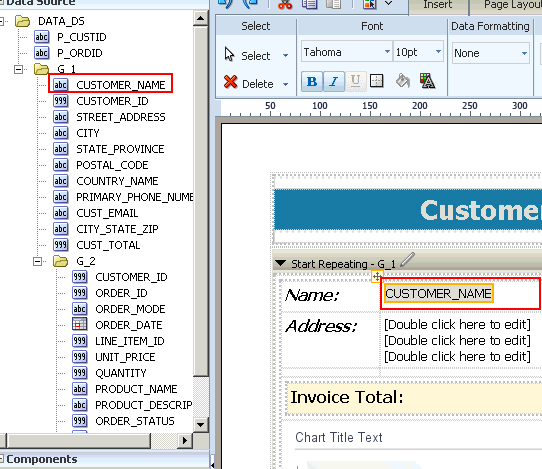 Click Edit (the pencil icon) to select the element to group by in the repeating section. In this example, it isCUSTOMER_NAME.  If you expand the repeating section, you will see that it contains the element CUSTOMER_NAME. Click OK or Cancelto return to the layout editor.  |
| 15 . | Insert the other details for the customer as shown in the screenshot. Drag the data items from the data set Customers in the left-side pane in this order.
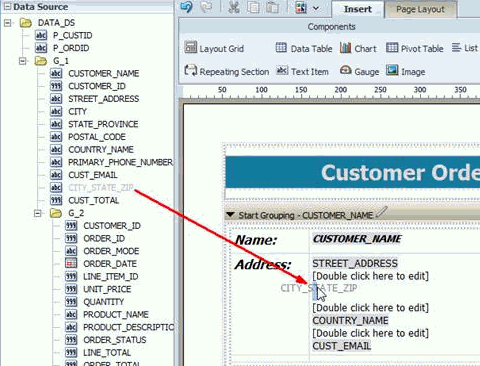 Observe that the Address section has a simplified field for CITY, STATE, and ZIP. This was created by adding the element by expression in the Data Model as explained previously. Recall how the element by expression forCITY_STATE_ZIP was created and observe how it is useful in creating a report now. |
| 16 . | For the Order Details table, drag the data items from Data Source in the left-side pane in the order given below.
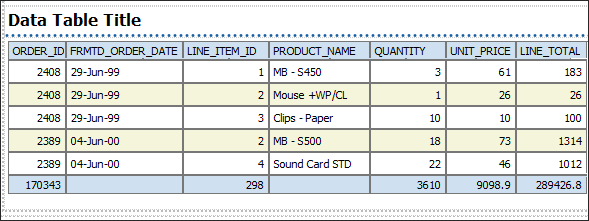 You can format the table display to suit your requirements. In this example, observe that the ORDER_ID data is grouped to the left of the column. 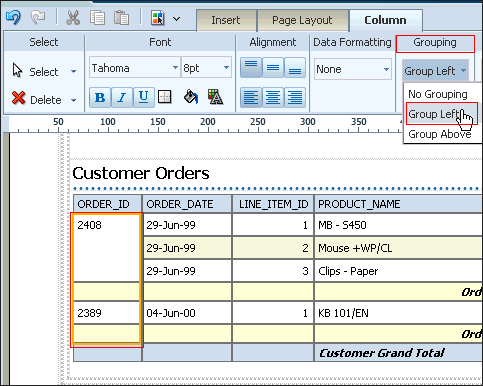 Also, observe that the Unit_Price column is defined with Currency format, using the Column > Data Formatting > Currency option. 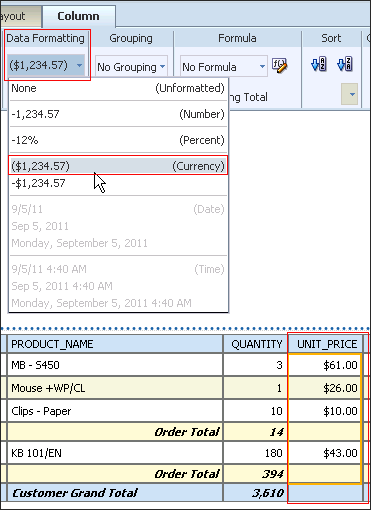 You can use either the column indicators to place the data properly inside the layout, or you can also use Table Properties to set the column width.  |
| 17 . | You can add a chart to the layout. This example uses the CUST_TOTAL item, which is based on the Line_Totalsdata item. Add the data element CUST_TOTAL from the data source to the Chart table.  Use the Line Total and Product_Name data from the data source to create the chart.  |
| 18 . | Name the layout Orders Summary. Click Save.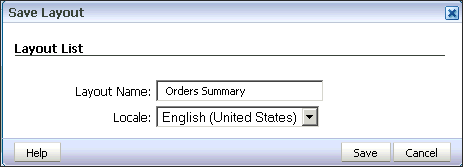 |
| 19 . | Click Interactive Preview > Interactive to preview the layout.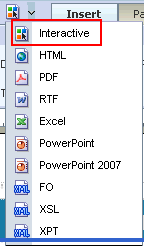 |
| 20 . | The report is displayed in the Interactive Viewer browser. Close the browser.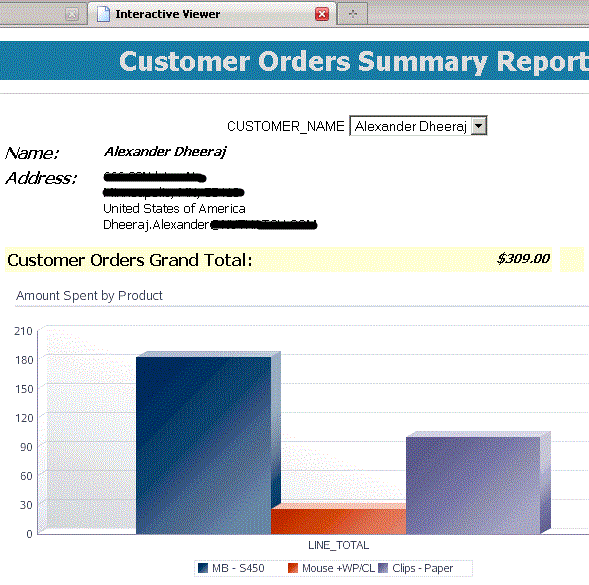 Save the layout and click Return to return to the report editor.  |
| 21 . | In the report editor view, save the report and click View Report.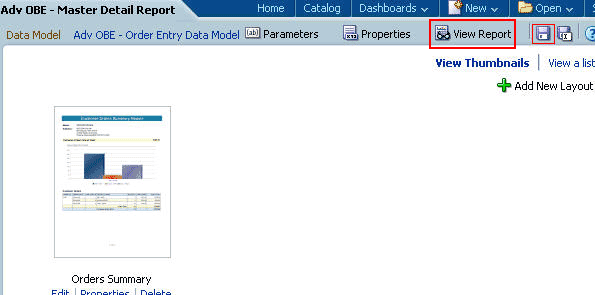 The report is displayed with the defined layout. The data is displayed based on the criteria you select in the report view. In this example Alexander Dheeraj is chosen for Customer Name, and All for Order Numbers. The screenshot is edited to display the wide and flowing screen view in one go. 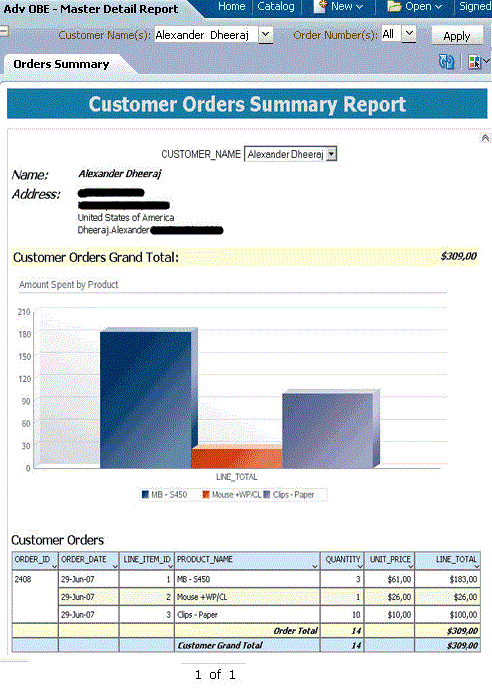 This concludes the topic "Creating a Master Detail Report." |
Creating Reports with Consistent Look and Feel Using Subtemplates
This topic will cover creating a subtemplate, uploading it to the server, and then using it to create a report with consistent look and feel.
In this topic you will learn how to create an RTF subtemplate, and how to use it to generate reports with a common look and feel. For example, add a company logo to the header section of reports and other documents that you create using Oracle BI Publisher.
Creating an RTF Subtemplate
A subtemplate is a capsule of formatting functionality that is defined once and used multiple times within a single RTF layout template or across multiple RTF layout template files. Subtemplates can be in either RTF or XSL file format. This topic covers creating a subtemplate in the RTF format.
In this example, you will create an RTF subtemplate, upload it to the Oracle BI Publisher server, and associate it with reports.
| 1 . | Open a blank document in MS Word. |
|---|---|
| 2 . | Type (or copy and paste) <?template:Header?> in the body of the document. Note: Header is the name of the code snippet (template) inside the subtemplate file. You can include multiple template codes in the same subtemplate.  Press Enter. |
| 3 . | Insert the Oracle logo O_signature_clr.gif located in My Templates and Files. You can use any GIF image relevant to your company or company logo, too. Remember to copy the .gif file into this folder. Press Enter. |
| 4 . | Enter My Employee Salary Report as the title and center the text. Format the title as you deem appropriate. Press Enter. 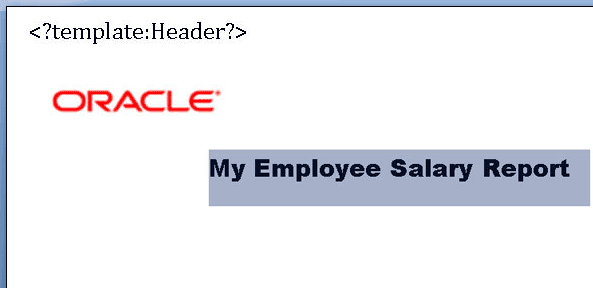 |
| 5 . | Type (or copy and paste) <?end template?> to close the Header template instructions. The RTF file should look similar to this:  |
| 6 . | Save the subtemplate as headerfooter.rtf in the Learn folder. |
| 7 . | a. Type or copy and paste <?template:Footer?> in the body of the document. Note: Footer is the name of the subtemplate. Consider copying and pasting this code into the template. b. Type or copy and paste ****Confidential**** and center the text. Format the footer as you deem appropriate. c. Insert a page number and right-justify the page number. d. Type or copy and paste <?end template?> to close the Footer template instructions. The RTF file should look similar to this:  e. Save the subtemplate again. Next, you will have to upload the subtemplate to the BI Catalog. |
| 8 . | a. Log in to the OBIEE (http://<host>:<port>/analytics) b. Click New > Sub Template from the global header.  |
| 9 . | Click the Upload ( ) icon. ) icon.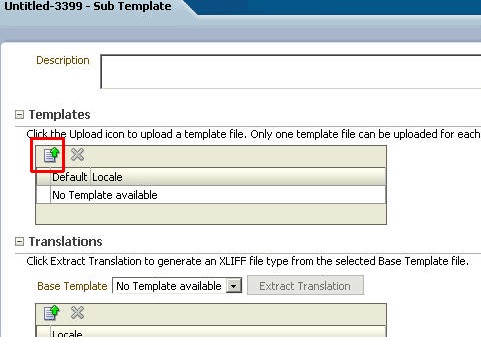 |
| 10 . | a. Select the subtemplate file headerfooter.rtf that you just created. The example shows the file being selected from the local folder.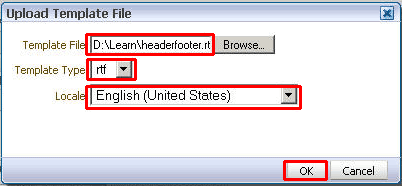 b. Accept the default Template Type, and select English (United States) as the Locale. c. Click OK. |
| 11 . | a. In the template editor window, click Save. b. Navigate to \Shared Folders\Sample Lite\Published Reporting\Reports and save your file asHeader Footer Sub Template to the Oracle BIEE Catalog. In this example, you are saving the subtemplate in the same folder that will hold the report in which you will call the subtemplate. If you are saving the subtemplates in a separate folder, then you must have access permissions between the folder containing the reports and the one containing the subtemplates.  c. Click OK. |
| 12 . | Next, you will modify an existing RTF template (the main template) to call your subtemplate file. Begin by opening the Manager Financials Report.rtf file. This file is available in the My Templates and Files folder. This folder is made available to you along with the OBE. 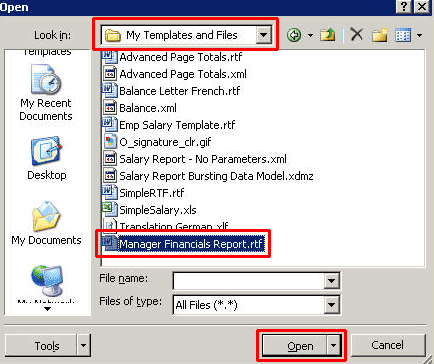 |
| 13 . | The report will look like this: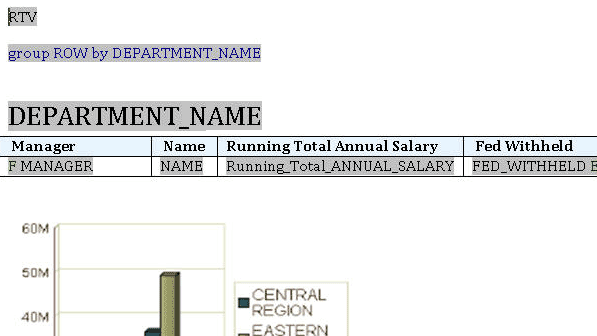 |
| 14 . | a. You must have at least two entries to call your subtemplate. These entries are the import and call statements. Just above the RTV code field, press Enter twice. b. On the first line, type or copy and paste <?import:xdoxsl:///Sample Lite/Published Reporting/Reports/Header Footer Sub Template.xsb?>. Header Footer Sub Template is the name of the subtemplate on the Oracle BI Publisher server. 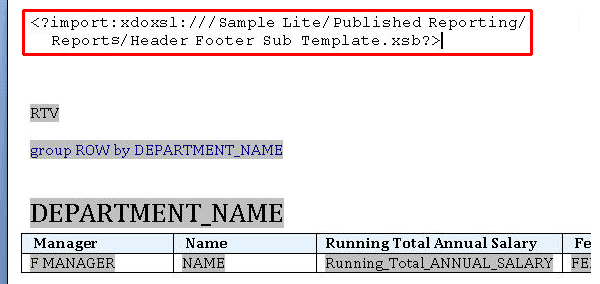 |
| 15 . | a. Insert a blank header (Insert > Header > Blank).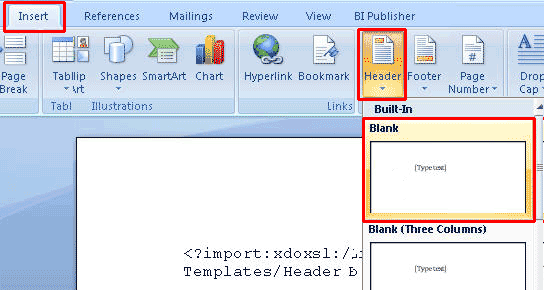 b. Type or copy and paste the following code: <?call:Header?>. 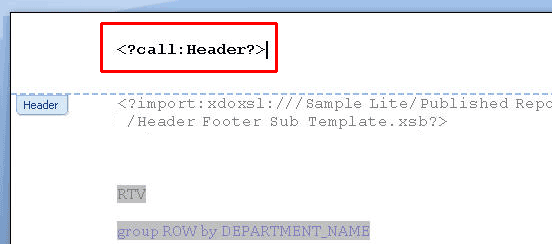 |
| 16 . | Scroll down to the footer area. In the footer area, enter the following code: <?call:Footer?>.  Close the header and footer. |
| 17 . | Save the RTF file as My Financials For Sub Template.rtf in your Learn folder on your hard drive.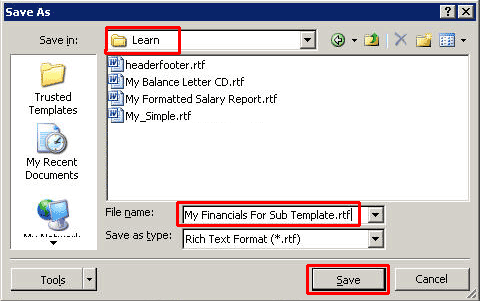 |
| 18 . | Next, you will create a new report that uses this RTF template. In the OBIEE home, click New > Report.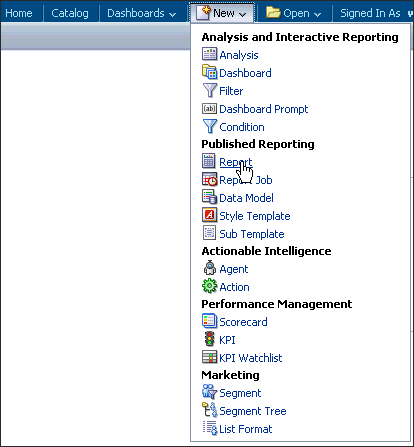 |
| 19 . | Select Salary Report Data Model and click Open. |
| 20 . | Click Upload in the report editor. The Upload Template File dialog box appears. |
| 21 . | a. Enter My Main RTF in the Name text box.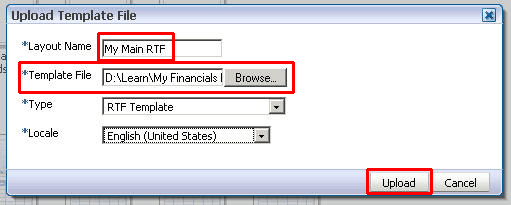 b. Browse to locate the main template file My Financials For Sub Template.rtf. c. Select RTF Template as the Type and English (United States) as the Locale. d. Click Upload. |
| 22 . | The template appears in the report editor. Click Save.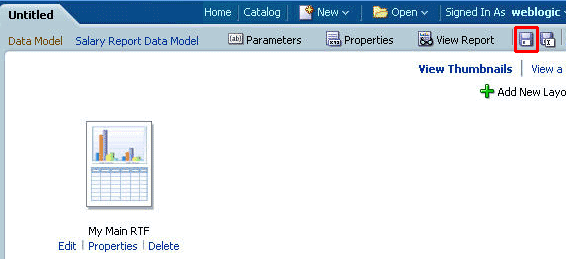 |
| 23 . | Save the report as My Financials ST Rpt in \Shared Folders\Sample Lite\Publisher Reporting\Reports. |
| 24 . | Click the View Report button. |
| 25 . | The report is displayed. This screenshot is altered to fit the contents of the flowing screen in one go.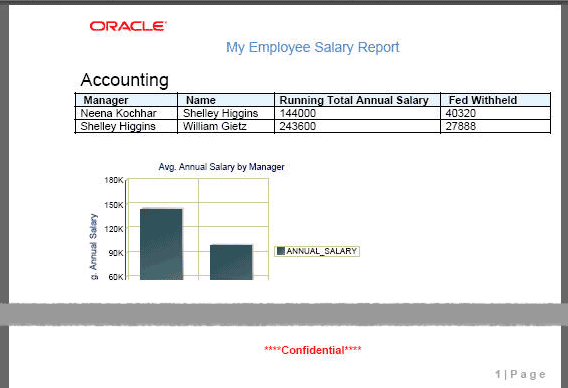 |
Digitally Signing and Securing PDF Documents
In this topic, you learn how to add a digital signature and to password-protect PDF documents.
The following two topics are covered:
The following two topics are covered:
- Configuring PDF security options for a report
- Configuring a digital signature and signing PDF output reports
Configuring PDF Security Options
PDF security settings control security options for PDF documents and they can be set at the server level or at the report level.
Server-level PDF security settings apply to all PDF documents that you generate using Oracle BI Publisher.
In this example, you will set PDF security options for a specific report to be published. PDF security settings at the report level are configurable in the Formatting tab of the Report Properties dialog box.
| 1 . | Log in to the Oracle BIEE. |
|---|---|
| 2 . | Select the report that you created in the previous topic "Creating a Master Detail Report." Navigate through Catalog>>My Folders>>Learn>>Adv OBE - Master Detail Report. Click Edit. 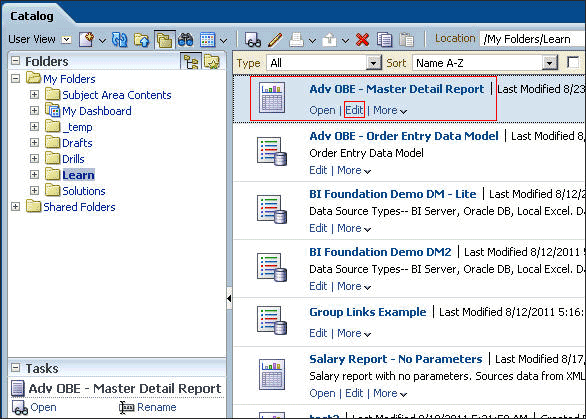 |
| 3 . | The selected report is displayed in the report editor. In this example, the report is Adv OBE - Master Detail Report. Click the Properties button. |
| 4 . | Select the Formatting tab in the Properties window. Examine the server value settings for PDF Output. Observe that the values for PDF security are null. At run time, they default to the server value settings.  Click OK or Cancel to get back to the report editor window. |
| 5 . | Click the View Report link . .View the report in PDF format by choosing the PDF view as shown in the screenshot.  |
| 6 . | Click Edit Report to return to the report editor page. |
| 7 . | Click the Properties button. |
| 8 . | In the Report Properties window, click the Formatting tab to modify the following PDF output settings: a. Set the following properties to True.
 c. Click OK and click Save  to save the modifications to the report properties. to save the modifications to the report properties. |
| 9 . | Click the View Report button in the report editor window. This time, Adobe Acrobat prompts you for a password before opening the PDF document. Provide the password that you set in the previous step. 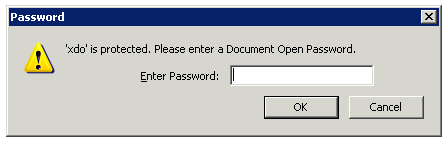 |
| 10 . | Examine the PDF document permissions. You can observe the security settings for the document by selecting Security Settings to the left of the document. Verify that they match the PDF security settings that you selected in the previous steps.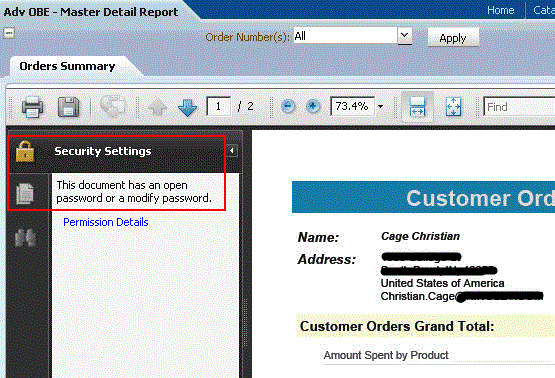 |
Configuring a Digital Signature and Signing PDF Output
Prerequisite
Before completing this part, you must copy the digital ID file JohnSmith.pfx (included with the setup files provided for this OBE in My Templates and Files) to a folder of your choice in the file system on the server. Oracle BI Publisher server must have access to the location to which you copy this file. In this example, the file is available at My Templates and Files on the D drive.
Before completing this part, you must copy the digital ID file JohnSmith.pfx (included with the setup files provided for this OBE in My Templates and Files) to a folder of your choice in the file system on the server. Oracle BI Publisher server must have access to the location to which you copy this file. In this example, the file is available at My Templates and Files on the D drive.
Introduction
Oracle BI Publisher supports digital signatures on Oracle BI Publisher reports delivered in PDF format. Oracle BI Publisher can access your digital ID file from a central, secure location and, at run time, sign the PDF output with the digital ID.
Before you can implement digital signatures with Oracle BI Publisher reports, you need a digital ID obtained from a public certificate authority or from a private/internal certificate authority. You must copy the digital ID file to a secure location of the file system on the server that is accessible by the Oracle BI Publisher server.
In this example, you will learn how to configure Oracle BI Publisher server to use a digital ID file, and how to attach the digital signature to a PDF output when you schedule a report.
Registering the Digital ID in the Oracle BI Publisher Administration Page
| 1 . | On the Administration page, under Security Center, click Digital Signature.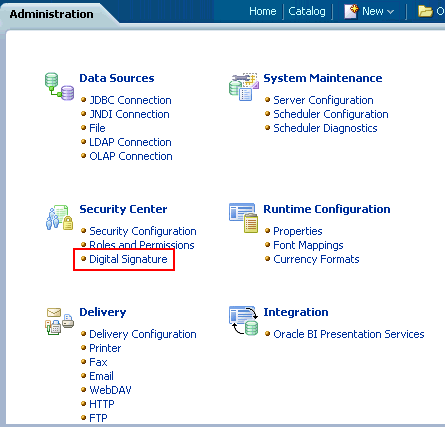 |
|---|---|
| 2 . | a. Enter the path to the digital ID file in the Digital ID File text field. In this example, it is shown as / My Templates and Files/JohnSmith.pfx. b. Enter oracle in the Password field. 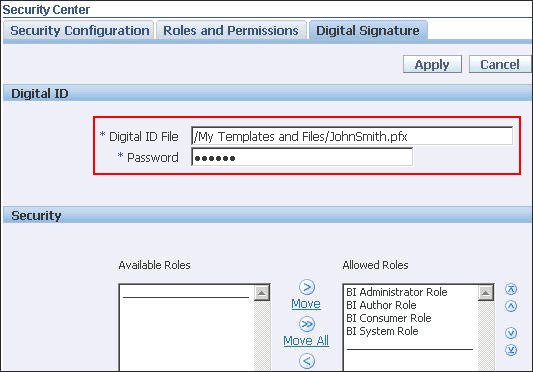 |
| 3 . | a. Enable the roles that will have the authority to sign documents with this digital ID. Use the shuttle buttons to move Available Roles to the Allowed Roles list.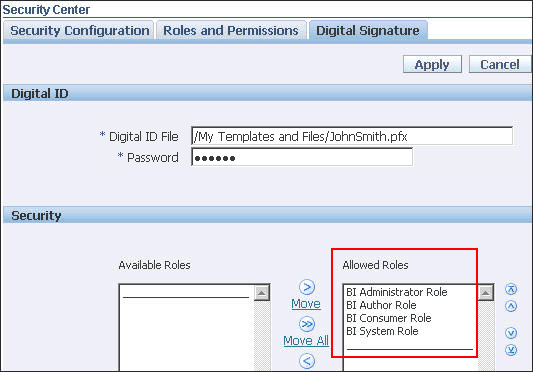 b. Click Apply. |
| 4 . | The confirmation message is displayed.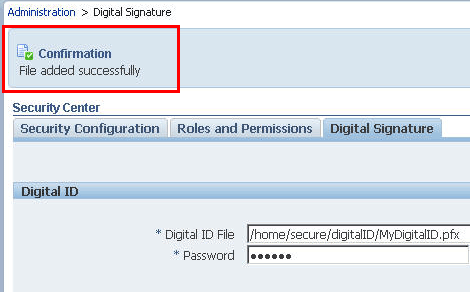 |
Enabling Digital Signature for a Report in Report Properties
After you register a digital ID file, you can use it to sign PDF output documents generated at run time when you schedule reports. The digital signature verifies the signer's identity and ensures that the document has not been altered after it was signed.
You use the Formatting tab in the Report Properties dialog box to enable digital signatures for reports and to specify the position to place the digital signature on the completed PDF document. All layouts assigned to the same report share the digital signature properties. This example uses an RTF template.
You use the Formatting tab in the Report Properties dialog box to enable digital signatures for reports and to specify the position to place the digital signature on the completed PDF document. All layouts assigned to the same report share the digital signature properties. This example uses an RTF template.
| 1 . | In the Catalog, navigate to the report My Folders/Learn/ Adv OBE - Master Detail Report. Click Edit to open the report for editing.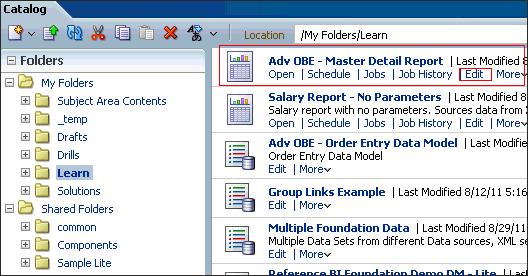 |
|---|---|
| 2 . | Click Properties and then click the Formatting tab. Scroll to the PDF Digital Signature group of properties. Observe that there is no value set for the digital signature location. |
| 3 . | a. Set the Enable Digital Signature value to True. b. From the "Signature field location" drop-down menu, select Top Left. 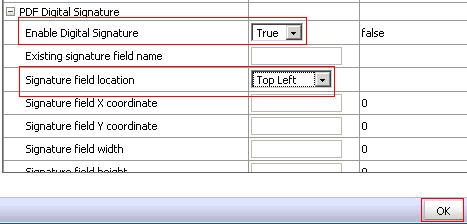 c. Click OK. |
| 4 . | On the global header, click New>>Report Job. |
| 5 . | a. Select the edited report in the Learn folder for scheduling.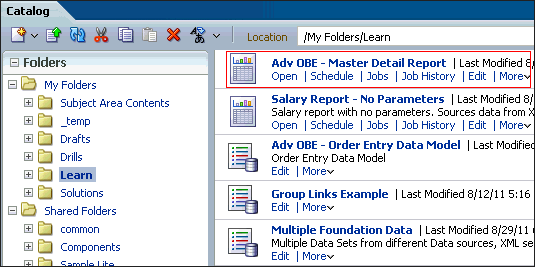 b. In the Output tab, select the Layout as RTF, and the Output format as PDF. In this example the RTF layout name is Order Summary. 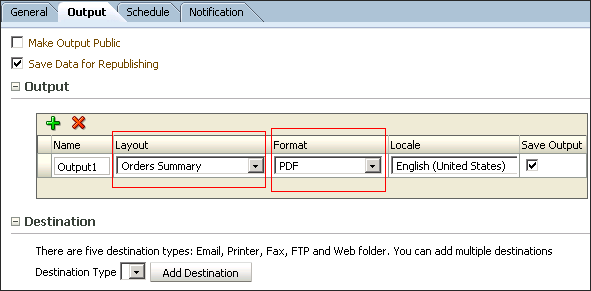 c. Schedule the report by selecting the Frequency as Once and the Run Now option. 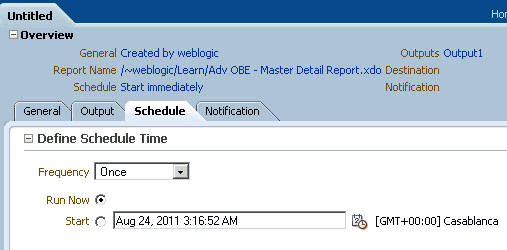 d. Submit the job. Provide a name. In this example, the name of the job is Digital Sign. You will get a confirmation message after the successful submission of the job. 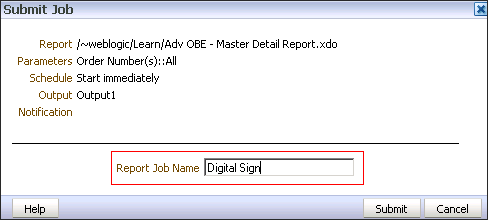 |
| 6 . | In the Catalog, navigate to My Folders > Learn, select Adv OBE - Master Detail Report. Expand the More menu, and select History. This will open the Report Job History window with the submitted job name, Digital Sign. Click the report job Digital Sign.  |
| 7 . | The Report Job Details window is displayed. Click Output1 under the Output and Delivery section. Recall that the output format you have chosen while scheduling this report is PDF.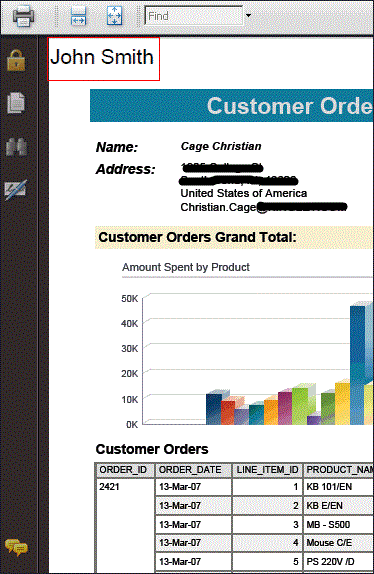 |
| 8 . | The scheduled report in the PDF format is displayed with the newly applied digital signature John Smith. This concludes the topic on digitally signing a report. |
Bursting
Bursting is the process of splitting data into blocks, generating documents for each block, and delivering the documents to one or more destinations.
A single bursting definition provides the instructions for splitting the report data, generating the document, and delivering the output to its specified destinations.
A single bursting definition provides the instructions for splitting the report data, generating the document, and delivering the output to its specified destinations.
In this topic, you will learn how to use scheduler diagnostics to check connections, edit the Data Model for bursting a report to a file location, and view the Job History for the scheduled report.
Reviewing the Scheduler Configuration:
In this subtopic, you will use Oracle BI Publisher's Administration page to review the scheduler configuration.
| 1 . | a. Log in to Oracle BI Publisher and go to the Administration page. b. On the Administration page, in the System Maintenance section, click Scheduler Configuration to examine the database connection.  |
|---|---|
| 2 . | a. The Scheduler Configuration page appears. Examine the Database Connection area. It should show the JNDI connection by default. b. Click Test Connection. A confirmation message appears if the database connection is successfully established.  |
| 3 . | Click the Scheduler Diagnostics tab. Review the results. The Result area must show “passed” as indicated in the following screenshot.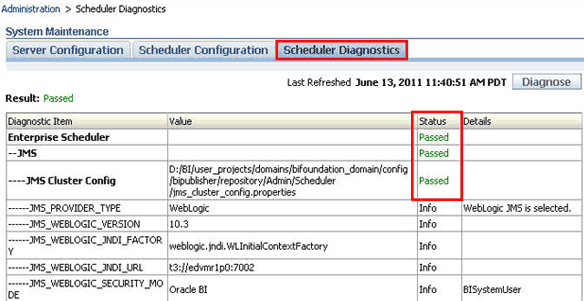 |
Scheduling a Report to Burst to a File Location:
In this subtopic, you will edit the existing Data Model, associate it to the Salary report in the available database, and then schedule this report to burst to a file location on your local hard drive, or the D drive as demonstrated in the example below.
Prerequisite:
You will need to create a folder under your local drive named BIP. This is the folder to which the reports will burst when you schedule the report to burst.
You will need to create a folder under your local drive named BIP. This is the folder to which the reports will burst when you schedule the report to burst.
| 1 . | a. From the Catalog page, navigate to My Folders and select New > Folder. b. Enter My Bursting Model as the folder name and click Create. 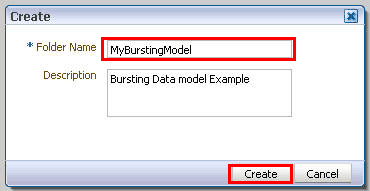 |
|---|---|
| 2 . | a. Select this new folder. In the Tasks pane, click Upload. b. In the Upload dialog box, click Browse.  |
| 3 . | Navigate to My Templates and Files and open Salary Report Bursting Data Model.xdmz. This is a prebuilt Data Model. Click Open. The My Templates and Files folder is made available to you when you start working on the OBE. This is a prerequisite.  |
| 4 . | a. Click Upload.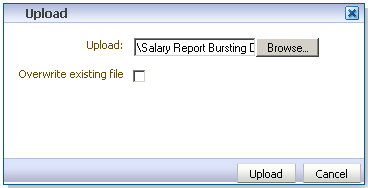 b.The Data Model appears in your new folder.  c. Click Edit to edit the Data Model. |
| 5 . | a. The Data Model Editor is opened. Observe that "demo" is selected as the Default Data Source for the Data Model. This is part of the data source configuration. b. Click the Bursting node in the Data Model pane. This will open the Bursting pane. 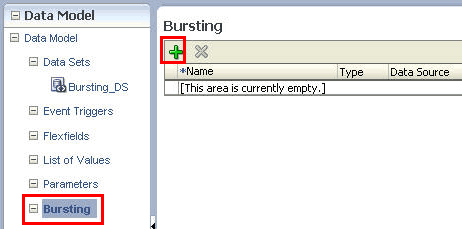 c. Click the add icon  in the Bursting pane. The Bursting pane expands and provides an additional definition area. in the Bursting pane. The Bursting pane expands and provides an additional definition area.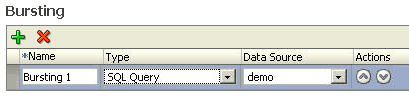 d. Enter the following information in the Bursting panes: 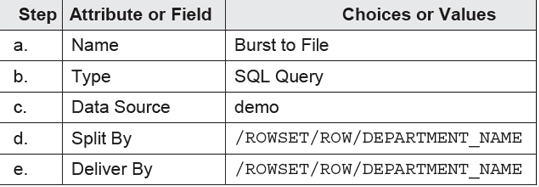 |
| 6 . | a. In the SQL Query pane below the Query Builder button, copy and paste this code:
select
b. Your output will be delivered to the folder specified in the bursting model. In this example, it is BIP. Notice that the code includes the name of the template (SimpleRTF). The Data Model should look like this:d.department_name KEY, 'SimpleRTF' TEMPLATE, 'RTF' TEMPLATE_FORMAT, 'en-US' LOCALE, 'PDF' OUTPUT_FORMAT, 'FILE' DEL_CHANNEL, 'D:\BIP' PARAMETER1, d.department_name || '.pdf' PARAMETER2 from departments d  Here is a brief description of the bursting definition used in the example: Bursting definition is a component of the Data Model. After you have defined the data sets for the Data Model, you can set up one or more bursting definitions. When you set up a bursting definition, you define the following:
 to save the Data Model. to save the Data Model. |
| 7 . | Click New > Report on the global header. |
| 8 . | Select Salary Report Bursting Data Model from your new folder and click Open. |
| 9 . | The report editor window is opened. Click Upload.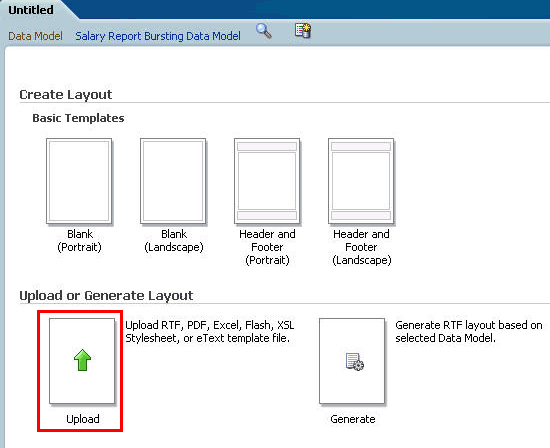 |
| 10 . | a. In the Upload Template File dialog box, enter SimpleRTF. b. Click Browse. Navigate to the My Templates and Files folder, select SimpleRTF.rtf, and click Open. c. Select RTF Template as the Type and English (United States) as the Locale. The dialog box should look like this:  d. Click Upload. |
| 11 . | a. Click Save and name the report "Salary Report for Bursting" in the My Bursting Model folder underMy Folders. b. The saved report with the name appears in the report editor window.  |
| 12 . | a. Click the Properties button. The Report Properties dialog box appears.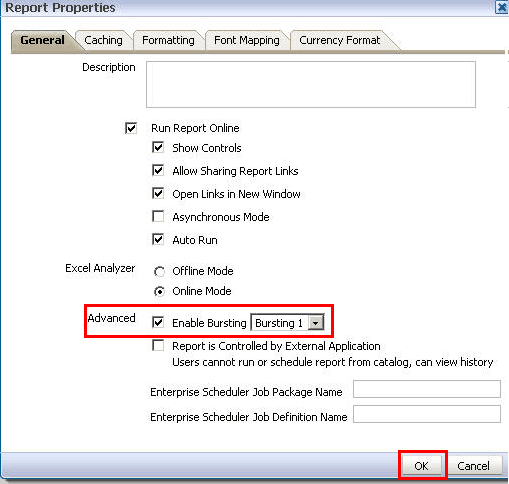 b. In the General tab in the Advanced area, select the Enable Bursting check box and ensure that “Bursting 1” is selected from the drop-down list. c. Click OK. d. Click Save |
| 13 . | Click New > Report Job to schedule this report with bursting as the output option.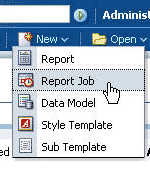 |
| 14 . | On the General tab, navigate to the My Bursting Model folder and select Salary Report for Bursting. |
| 15 . | On the Output tab, select the “Use Bursting Definition to Determine Output & Delivery Destination” check box to enable bursting. Observe that the other options for output will be hidden when this check box is selected.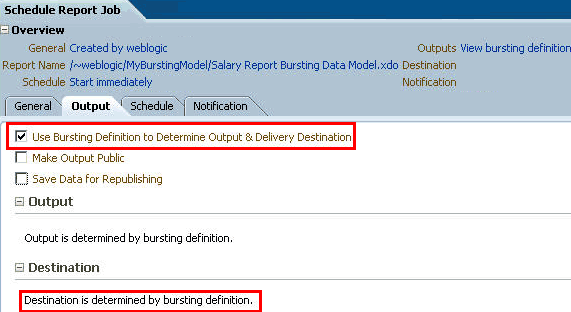 |
| 16 . | On the Schedule tab, select Frequency to report as Once and the Run Now option. |
| 17 . | If the Notification tab is disabled in your instance, you don't have to define anything here. Note: You will be able to use this option only if a delivery channel is set up in your environment. Without a mail server set up, this option will be disabled. In this example, it is shown as user@localhost.com. You can enter the email address configured to your mail server.  |
| 18 . | a. Click Submit. b. Name the scheduling job as Bursting2File in the Submit Job dialog box, and then click Submit. |
| 19 . | a. From the Catalog, select the Salary Report for Bursting report. Click the Job History link. The Report Job History for the recent schedule job Bursting2File is listed as successful. 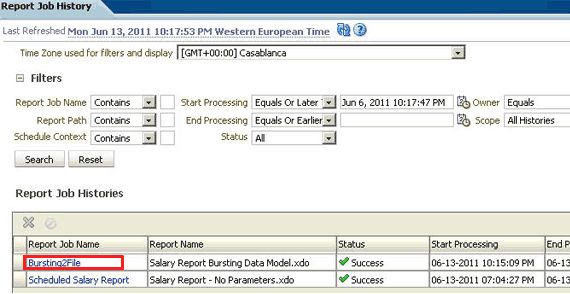 b. Observe that your job has completed successfully. You can click Report Job to view the details.  Expand the Bursting2File node in the Output Name column. It will show all the document outputs and related information like where they are delivered, split-by field, and so on.  |
| 20 . | Navigate to the BIP folder and review the contents displaying the burst reports at the specified location. In this example, it is the BIP folder that you have created as part of the prerequisite. |
| The steps above demonstrated the scheduling of a report to burst to a file location. |
Translating Reports
Oracle BI Publisher supports two types of translations. They are:
- Catalog translations: This enables you to extract the translatable strings from all objects contained in a selected Catalog folder
into a separate file; this file can then be translated and uploaded back to Oracle BI Publisher and assigned the appropriate language code. - Template translations: There are two methods for template translations.
(1) A localized template - a separate template file (RTF, PDF, XPT, EXCEL, and so on) in the desired language
(2) An XLIFF file - a file in XML format that includes the translations in the target language of all the text strings included in the "Base" template
Translating reports by using an XLIFF file enables you to extract the translatable strings from a single RTF-based template (including subtemplates and style templates) or a single Oracle BI Publisher layout template (.xpt file). Use this option when you need only the final report documents translated. For example, you need to generate translated invoices to send to German and Japanese customers. When you extract the translatable strings for a catalog or template translation, BI Publisher creates an XLIFF file that contains the strings. This topic covers examining the options for translating the reports, and creating translation files by using Oracle BI Publisher Enterprise.
Translating by Using a Localized Template
While working on this topic, the assumption is that you already have an RTF file that is translated into French. This template "Balance Letter French.rtf." is provided with the OBE as an attachment. You will use the Balance Letter.rtf template while working on this example. The example begins with examining the report in the default English template (Balance Letter.rtf). Then you are going to add a French (localized) version of the RTF template to this report to view the report in French.
| 1. | Log in to Oracle BIEE. (URL: http://localhost:7002/analytics. The host could be different for your instance; please check and make sure you are logging in to the Oracle BI EE). Use your credentials to log in. .  |
|---|---|
| 2. | Navigate to the Balance Letter located in \Shared Folders\Sample Lite\Published Reporting\Reports. Click Open.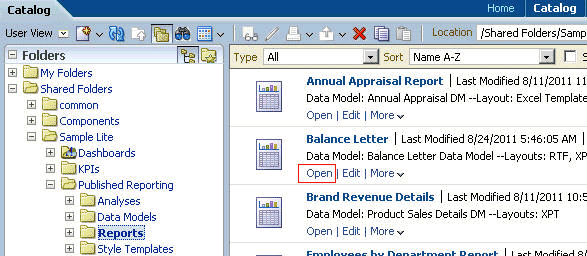 |
| 3. | Observe that the report is using the default English RTF template. Assume that you have a French customer to whom you need to send the report in French only. For this, you need to upload a French RTF template, which can be applied on the same report.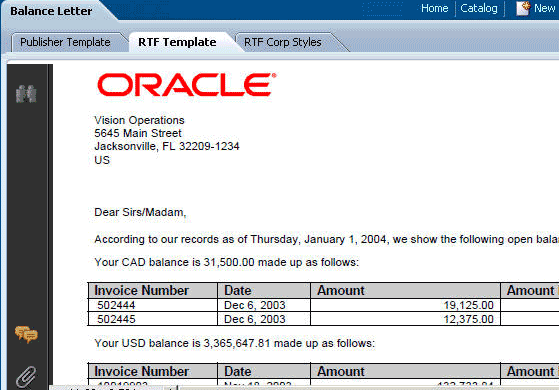 |
| 4. | Navigate to “My Templates and Files” and open Balance Letter French.rtf. Click OK. Examine the RTF file. You would need to build this translation file yourself or send it to a third-party vendor for translation. |
| 5. | Get back to the Catalog window. Navigate to the Balance Letter located in \Shared Folders\Sample Lite\Published Reporting\Reports. Click Edit. |
| 6. | The report editor appears. Click the Properties link for RTF Template (the basic Balance Letter). |
| 7. | The template manager window opens. In the Templates table, click the Upload icon.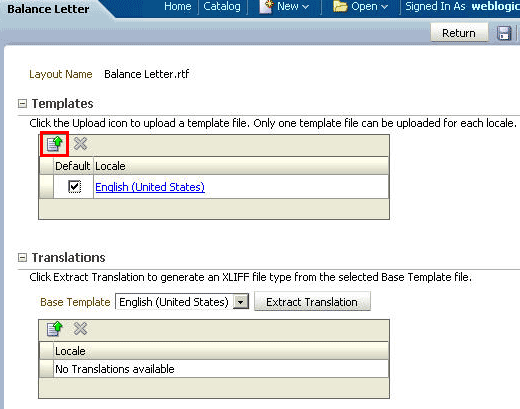 |
| 8. | The Upload Template File dialog box appears.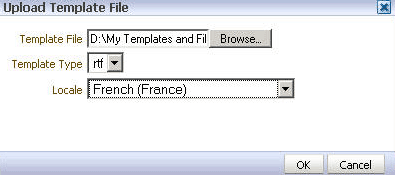 Browse to locate the localized translation file. Navigate to “My Templates and Files” and select Balance Letter French.rtf, and click Open.  |
| 9. | After selecting the RTF file, select "rtf" as the Template Type and then select French (France) as the Locale. Click OK. |
| 10. | The localized template appears in the Templates table. You can keep the Default template set to English. You just need to change the Locale to French in the user preferences of the report. Oracle BI Publisher automatically selects the appropriate template based on the user's locale. If one doesn't exist, then it uses the default (in this case, English) template.  Click Save and then click Return. |
| 11. | On the Oracle BIEE home page, click My Account. The My Account dialog box appears. |
| 12. | Click the BI Publisher Preferences tab and change Report Locale to français - France. Click OK and log out. |
| 13. | Log back in to the Oracle BIEE.(URL: http://localhost:7002/analytics) On the Catalog page, navigate to the previously edited Balance Letter and click Open to run the report. |
| 14. | The report appears in your browser window. Observe that the letter content is translated into French. Close the browser window. |
| 15. | On the Oracle BIEE home page, change your BI Publisher Preferences back to English. Click My Account and select the BI Publisher Preferences tab. Change the Locale back to English - United States from français - France.  Click OK. |
| 16. | When you run the report again, it will default to the English version.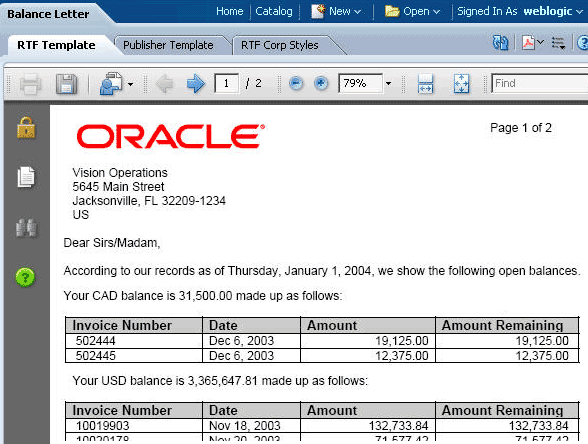 This concludes the example of translating the report with a localized template. |
Translating Reports by Using an XLIFF File
This example shows how to use an XLIFF (.xlf) file for translation. In this example, you will use an XLIFF file that can be used to translate the Balance Letter.rtf base template file from English to German at run time. This file is located in the My Templates and Files folder.
XLIFF is the XML Localization Interchange File Format. It is the standard format used by localization providers. When you extract the translatable strings for a catalog or template translation, Oracle BI Publisher creates an XLIFF file that contains the strings. You can translate these strings or send the file to a localization provider. You then upload the translated XLIFF file back to the catalog or the individual layout and assign it the appropriate locale.
| 1. | Log in to Oracle BIEE. Navigate to the Balance Letter located in \Shared Folders\Sample Lite\Published Reporting\Reports. Click Open. |
|---|---|
| 2. | The report is displayed. Select the default RTF template. |
| 3. | The template editor window displays the Translations table. In the Translations table, click Upload.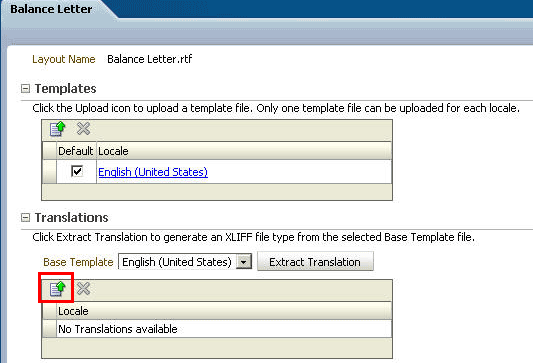 |
| 4. | The Upload Template File dialog box appears. Browse to locate the translation file. Navigate to My Templates and Files, and open Translation German.xlf. Select German (Germany) as the Locale. 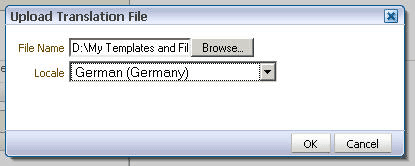 Click OK. |
| 5. | The translation file appears in the Translations table.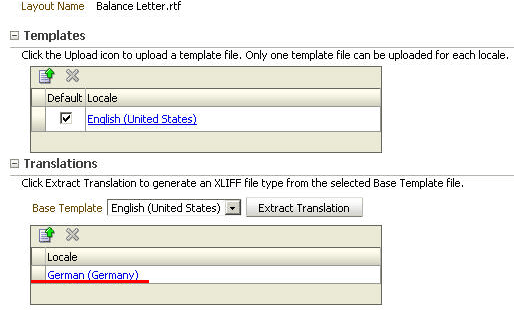 |
| 6. | Click Save and then click Return. |
| 7. | a. On the Oracle BIEE home page, click My Account. The My Account dialog box is displayed. b. Click the BI Publisher Preferences tab and change Report Locale to Deutsch - Deutschland. c. Click OK. |
| 8. | From the Catalog page, navigate to your Balance Letter and click Open to run the report. |
| 9. | The report appears in your browser window. Observe that the content is translated into German.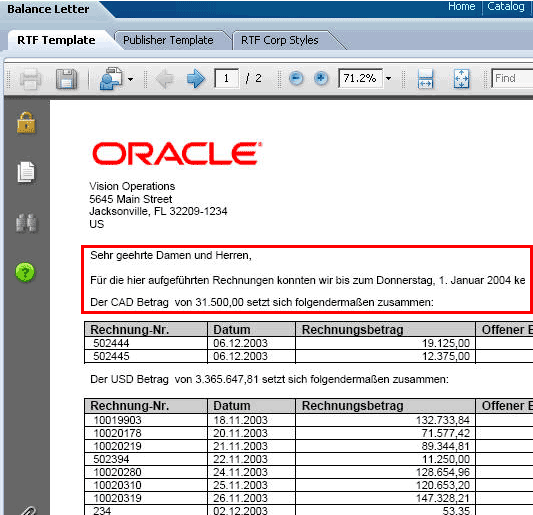 |
| 10. | Navigate to My Account. Change the BI Publisher Report Locale back to English - United States. 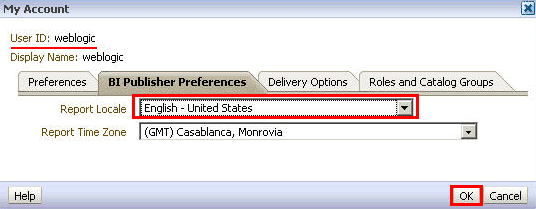 Click OK. |
| 11. | Verify once again that your default language is English by running the Balance Letter report again. This concludes the example of translating a report with an XLIFF template. |
Creating a Data Model with Multiple Data Sets
Oracle BI Publisher enables you to create a report from multiple data sources. This feature is very useful because you can pull the data into a single report based on multiple data sources. This topic will demonstrate how to create a Data Model with three to four data sets, and use them all to create a meaningful report.
In the Data Model editor, you combine data from multiple data sets from different data sources, such as SQL, Excel files, Web services, HTTP feeds, and other applications into a single XML data structure. Data sets can either be unrelated, or a relationship can be established between them using a data link. In this example, the Data Model is created with four data sets, in which three are SQL data sets, and one is an XLS file.
Creating a Data Model with Multiple Data Sets
| 1 . | Log in to the Oracle BIEE. Note: The assumption is that you have installed the BISAMPLE schema from Sample Sales as mentioned in the "Prerequisites" section. Make sure BISAMPLE is set as a Data Source in the Oracle BI Publisher Administration Page. |
|---|---|
| 2 . | On the global header, click New, and then click Data Model.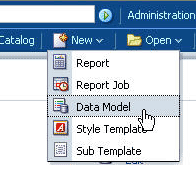 |
| 3 . | The Data Model Editor is displayed with the Components pane on the left and Work pane on the right. Selecting a component in the left pane will launch the appropriate fields for the component in the Work area. By default, when you open a data model in the editing mode, it displays the properties for the data model. Set the properties for this newly created data model now. |
| 4 . | Set the properties as given below:
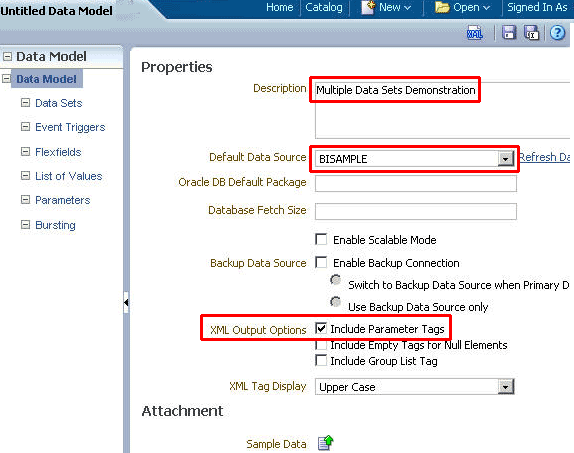 |
| 5 . | Click Save in the data model editor. The Save As dialog box is displayed. in the data model editor. The Save As dialog box is displayed.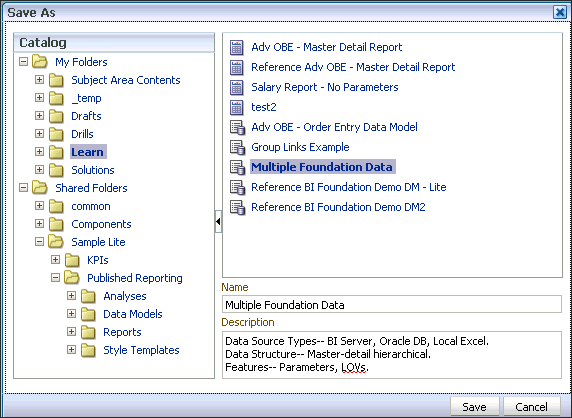 In the Save As dialog box, navigate to the Learn folder under My Folders and save it with the name Multiple Foundation Data. Now, add data sets to this data model. |
| 6 . | In the Components pane of the data model editor, click Data Sets. a. Click New Data Set.  b. Select the data set type from the list to launch the appropriate dialog box. In this example, select SQL Query. 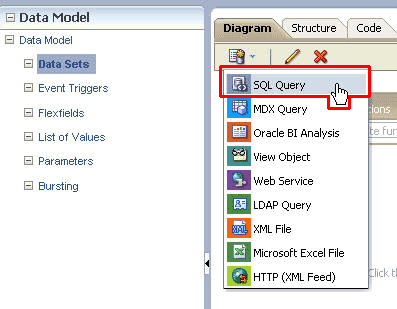 The Create Data Set - SQL dialog box appears. 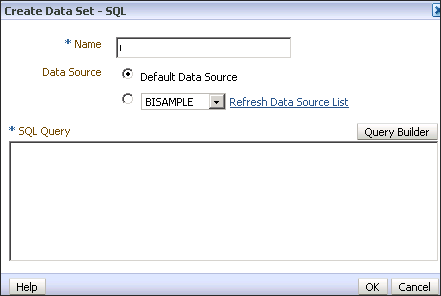 |
| 7 . | a. Enter the name for this data set as Q1- BI Server. b. Select and change the Data Source from the list of values to Oracle BI EE.  c. Click the Query Builder button. The Query Builder window is displayed. The Query Builder has two panes. They are the Object Selection pane and the Design and Output pane. The Object Selection pane contains a list of objects from which you can build queries. Only objects in the current data are displayed. Observe that this example displays Sample Sales Lite objects.  You will need to select the appropriate objects from the Object Selection pane in the left side of the Query Builder. |
| 8 . | a. Select the following objects from Sample Sales Lite. The selected objects appear in the Design and Output pane.
 b. Select the following data items in the displayed objects under the Model tab.
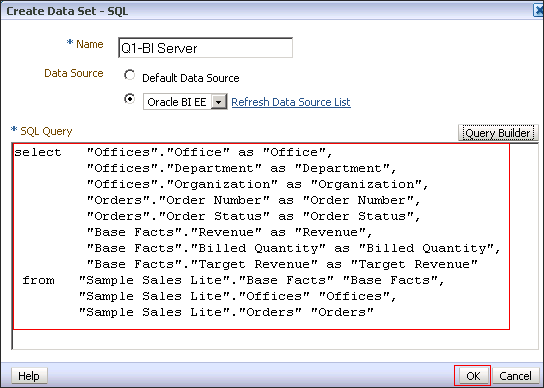 d. Click OK. This will save the data set. The data diagram is displayed for the newly created data set Q1-BI Server as G_1. 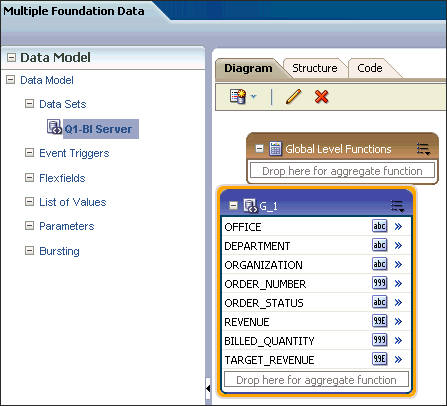 |
| 9 . | a. Click New Data Set to create another data set. b. Select the data set type from the list to launch the appropriate dialog box. In this example, select SQL Query. The Create Data Set - SQL dialog box appears. c. Enter a name for this data set as Q2-TransDB. Observe that the Data Source for this data set will remain set to the default, BISAMPLE.  d. Click the Query Builder button. The Query Builder window is displayed. Observe that the displayed data tables belong to BISAMPLE data. 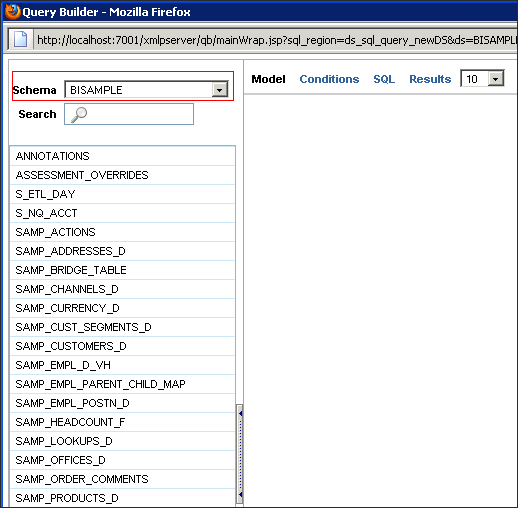 |
| 10 . | a. Select the following tables from the BISAMPLE data to get them to the Design and Output pane.
 b. You can create relationships between these objects by creating a join. A join identifies a relationship between two or more tables. In this example, you will create joins between the above three objects. You create a join by selecting the Join column adjacent to the column name for the selected object. The Join column appears to the right of the data type. Create the joins by selecting the following columns: SAMPL_PRODUCTS_D. PROD_KEY= SAMP_REVENUE_F.PROD_KEY 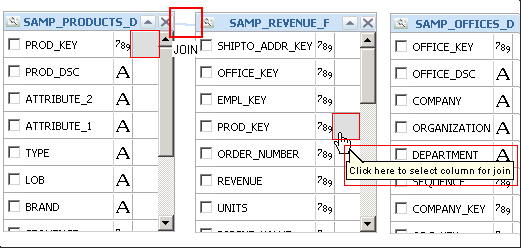 SAMP_REVENUE_F.OFFICE_KEY=SAMP_OFFICES_D.OFFICE_KEY  c. Select the following columns in these joined objects.
 d. Click the Save button. This will bring you back to the data set editor. Observe that the selected objects appear in the query. 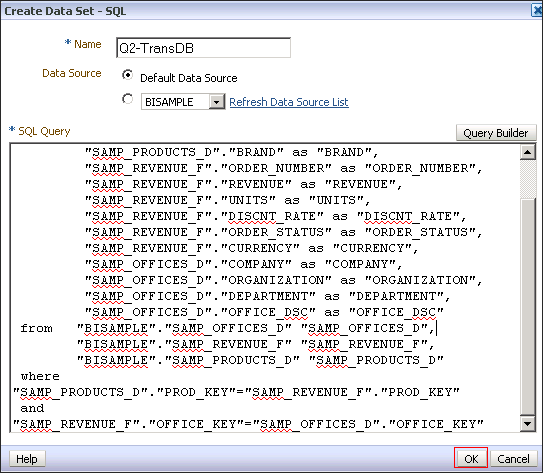 e. Click OK. This will save the data set. The data diagram is displayed for the newly created data set Q2-TransDB as G_2. 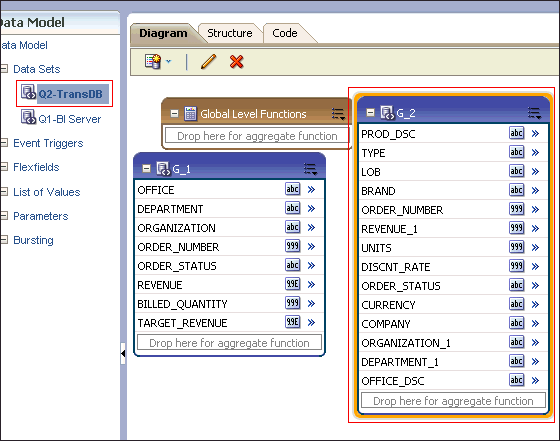 |
| 11 . | a. Click New Data Set to create another data set. b. Select SQL Query. The Create Data Set - SQL dialog box appears. c. Enter the name for this data set as Q3-Actual Sales. d. The data source for this data set is the same as the Q2 - the default data source BISAMPLE. 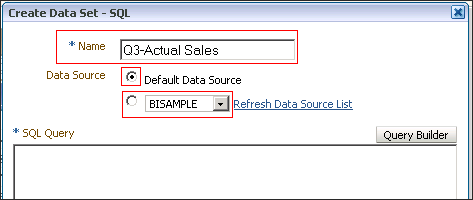 |
| 12 . | a. Enter the SQL query exactly as given below: select "SAMP_REVENUE_F"."OFFICE_KEY" as "OFFICE_KEY", "SAMP_REVENUE_F"."PROD_KEY" as "PROD_KEY", "SAMP_REVENUE_F"."BILL_MTH_KEY" as "BILL_MTH_KEY", "SAMP_REVENUE_F"."BILL_QTR_KEY" as "BILL_QTR_KEY", "SAMP_REVENUE_F"."CURRENCY" as "CURRENCY", sum("SAMP_REVENUE_F"."REVENUE") as "REVENUE", sum("SAMP_REVENUE_F"."UNITS") as "UNITS", "SAMP_PRODUCTS_D"."PROD_DSC" as "PROD_DSC", "SAMP_OFFICES_D"."OFFICE_DSC" as "OFFICE_DSC" from "BISAMPLE"."SAMP_OFFICES_D" "SAMP_OFFICES_D", "BISAMPLE"."SAMP_PRODUCTS_D" "SAMP_PRODUCTS_D", "BISAMPLE"."SAMP_REVENUE_F" "SAMP_REVENUE_F" where "SAMP_PRODUCTS_D"."PROD_KEY"="SAMP_REVENUE_F"."PROD_KEY" and "SAMP_OFFICES_D"."OFFICE_KEY"="SAMP_REVENUE_F"."OFFICE_KEY" group by "SAMP_REVENUE_F"."OFFICE_KEY", "SAMP_REVENUE_F"."PROD_KEY", "SAMP_REVENUE_F"."BILL_MTH_KEY", "SAMP_REVENUE_F"."BILL_QTR_KEY", "SAMP_REVENUE_F"."CURRENCY", "SAMP_PRODUCTS_D"."PROD_DSC", "SAMP_OFFICES_D"."OFFICE_DSC"  b. Click OK. The query is processed and a data diagram is displayed for this data set as G_3. 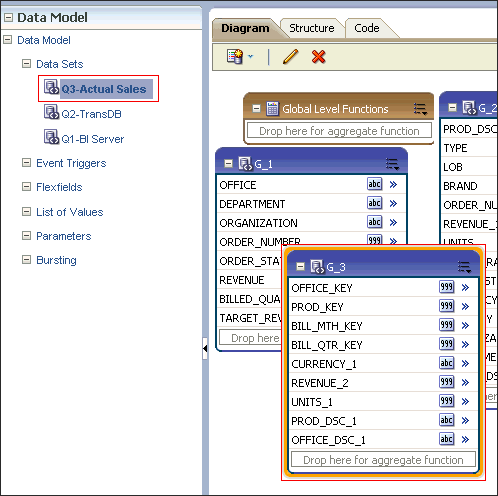 |
| 13 . | a. Click New Data Set to create a data set from the local Microsoft Excel file. b. Select the data set type from the list to launch the appropriate dialog. In this example select Microsoft EXCEL File. The Create Data Set - Excel dialog box appears.  |
| 14 . | a. Enter a name for this data set as Q4-Target Sales. b. You will have to select the Data Source where the Excel file resides. In this example, the data resides in a local MS Excel file.  |
| 15 . | a. You will have to select the option Local to enable the Upload button. Click the Upload icon  . .b. Browse the file SAMP_TARGETS_BIPDEMO.xls, and then click Upload. This file is available to you in the My Templates and Files folder.  |
| 16 . | If the Excel file contains multiple sheets or tables, you will have to select the appropriate Sheet Name or Table Name for this data set. In this example, the Excel file has multiple sheets, and the appropriate sheet name chosen is MNTH_TARGET_SALES.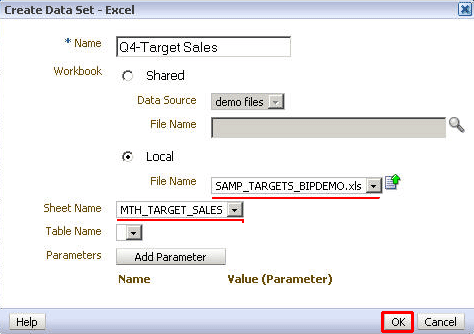 |
| 17 . | Click OK. This data set is also added in the Properties pane.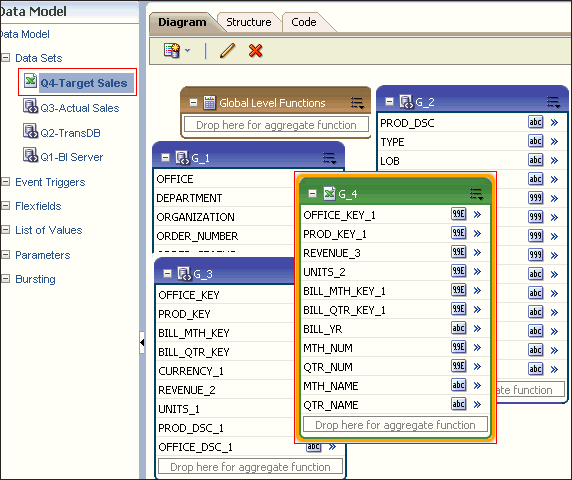 Save the data model. |
| 18 . | Link the data sets to define a master-detail (or parent-child) relationship between two data sets. Defining an element-level link enables you to establish the binding between the elements of the master and detail data sets. You will need to define the individual data links now. a. Select the data to be linked, and then click the Expand icon (  ) in the element action menu. In this example, it is OFFICE from the data set G_1. ) in the element action menu. In this example, it is OFFICE from the data set G_1. b. Select the Create Link action. |
| 19 . | a. The Create Link window is displayed with the available data for linking.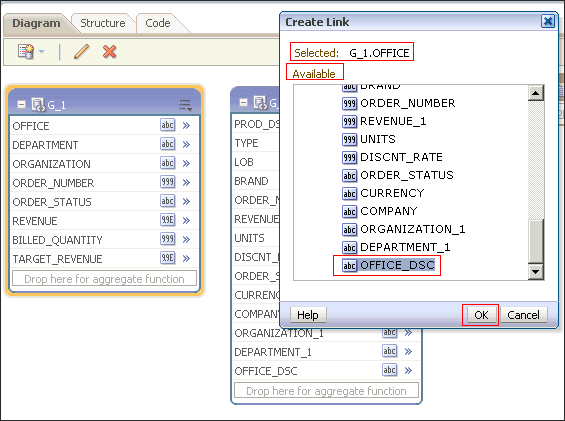 For this example, select OFFICE_DSC from the data set G_2. b. Click OK. |
| 20 . | A link between OFFICE and OFFICE_DSC for the two data sets G_1 and G_2 is created.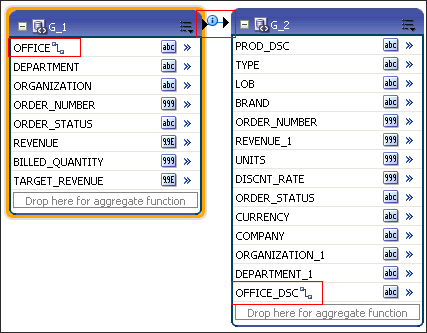 |
| 21 . | Similarly, you can create links for other data sets to suit your requirements.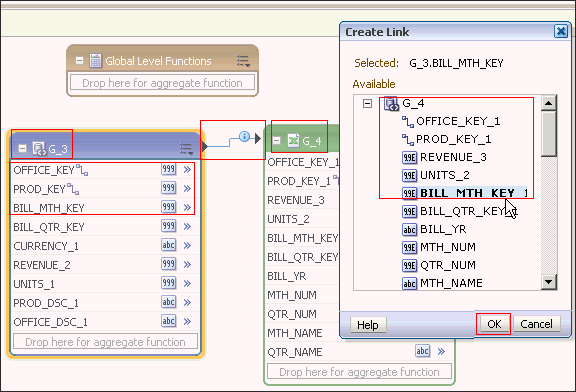 This example has the following element-level links between the data sets G_3 and G_4.
|
| 22 . | Save the data model.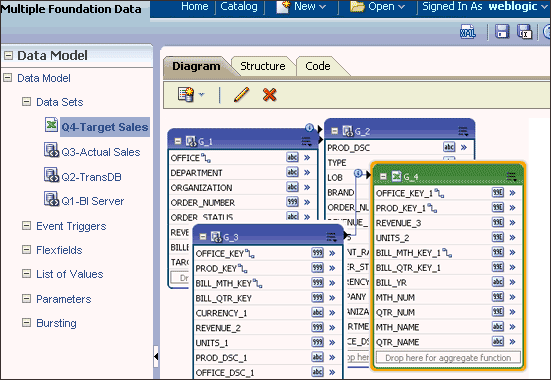 . . |
| 23 . | Now you are ready to run the XML output for this data model. Click the XML icon in the global header.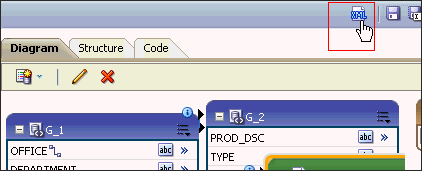 |
| 24 . | Choose the appropriate number of rows for the display. In this example, it is "five." Click Run. |
| 25 . | You can see the generated XML output. This concludes the example on creating multiple data sets.  |
Summary
In this tutorial, you have learned how to:
| Create a Master Detail Report | |
| Use subtemplates | |
| Configure advanced security options such as PDF security and digital signatures for reports | |
| Schedule and burst a report to a file location | |
| Translate reports | |
| Create a data model with multiple data sets |