Purpose
This tutorial covers some of the advanced features of Oracle Business Intelligence Publisher (Oracle BI Publisher), such as configuring advanced report options, creating a report with hyperlinks, scheduling a report to burst to a file location and email, analyzing data using the online and Excel analyzers, creating a report based on a data template, and creating a report based on multiple data sources.
Note: This tutorial is intended for the learners who are already familiar with Oracle BI Publisher and want to try out some of the advanced features, and who have already completed the tutorials: "Getting Started with Oracle Business Intelligence Publisher", and "Integration of Oracle BI Publisher with Oracle Business Intelligence Enterprise Edition."
Overview
You have already learned that Oracle BI Publisher (formerly known as XML Publisher) is a revolutionary reporting and document output management solution from Oracle, which can be used as a stand-alone reporting product, or integrated with Oracle Business Intelligence Enterprise Edition. You have explored many features of BI Publisher in the "Getting Started with Oracle BI Publisher" OBE, such as creating reports from various data sources—for example, Oracle Database, Web services, RSS feeds, Files, BI Answers, BI Server subject area—and also creating templates using BI Publisher Desktop in MS Word.
Oracle BI Publisher also enables you to create linked reports, create reports from XML data templates and multiple data sources, analyze data using online and Excel analyzers, bursting the reports to files and email, and so on. In this tutorial, you will be guided to explore these advanced features of BI Publisher.
Scenario
You will be using some of the reports that you have created in the other OBEs "Getting Started with Oracle Business Intelligence Publisher" and "Integration of Oracle BI Publisher with Oracle Business Intelligence Enterprise Edition." For example, you will use the simple employee salary report that you created based on the Oracle Database, and also other reports such as the report based on Web services, the report based on BI Server, and so on.So, to continue with the steps listed in the topics, you should have completed the two OBEs listed above, installed the required software, and performed the other setup as mentioned in the Prerequisites topic.
Before starting this tutorial, you should:
| 1. |
Have access to or have installed Oracle Database 10g (preferably version 10.2)
| |
| 2. |
Have access to or have installed the sample schemas (specifically HR, OE, and SH)
| |
| 3. | Have access to or have installed Oracle BI Publisher and Oracle BI Publisher Desktop 10.1.3.2.
You can install BI Publisher Desktop by clicking the Template Builder link in BI Publisher:
When you have successfully installed BI Publisher Desktop, the BI Publisher menu and BI Publisher toolbars are displayed in MS Word.
Note: Oracle BI Publisher Desktop was formerly known as Template Builder, and is mainly used for building the RTF templates for BI Publisher reports in MS Word. | |
| 4. | Have completed the tutorials "Getting Started with Oracle Business Intelligence Publisher" and "Integration of Oracle BI Publisher with Oracle Business Intelligence Enterprise Edition." | |
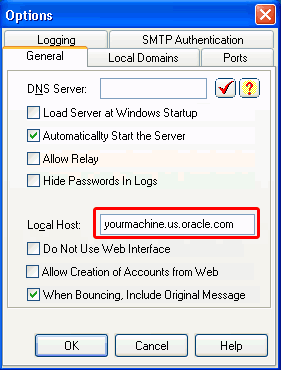
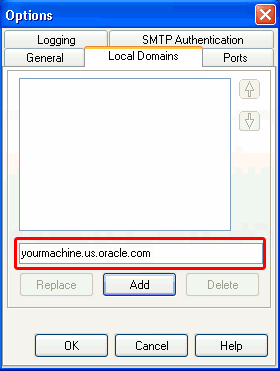
| 5. | Have set up the email server (ArGoSoft Mail Server Freeware) as given below:
Note: This tutorial uses ArGoSoft Mail Server Freeware for demonstration purposes only. If you do not have a mail server, follow these steps:
1. You can download this freeware mail server here.
2. Select the Mail Server Freeware agsmail.exe link. 3. Click Save to download the module onto your local machine. 4. Click Start > All Programs > Administrative Tools > Services and stop the Simple Mail Transfer Protocol (SMTP) service. Close Services. 5. Navigate to the directory where you stored the downloaded freeware module and double-click the agsmail.exe icon. Follow the vendor instructions for installation. This should not take much longer than one minute because it is a very light installation. 6. Start the ArGoSoft Mail Server service by double-clicking the ArGoSoft Mail Server Freeware icon stored on your desktop. 7. Click Tools > Users on the menu bar. When the User Setup window appears, click the New User icon. 8. The Add New User window appears.
9. Click Tools > Option on the menu bar. The Options window appears.
10. Launch your email client. This OBE uses MS Outlook Express. Ensure that all user properties correspond to the information annotated above. To do so, perform the following steps:
Note: Screen captures for this tutorial were taken in a Windows XP environment, therefore Start menu options may vary slightly. | |
In this topic, you will create a simple report based on the data from the Oracle Database (which contains the department location details), create a template for the report, and link it to the employee salary report (named Based on Oracle DB) that you have created in the OBE "Getting Started with Oracle Business Intelligence Publisher." Then you will view the data in BI Publisher by drilling down to another report.
To create a report with a hyperlink, perform the following steps:
1.
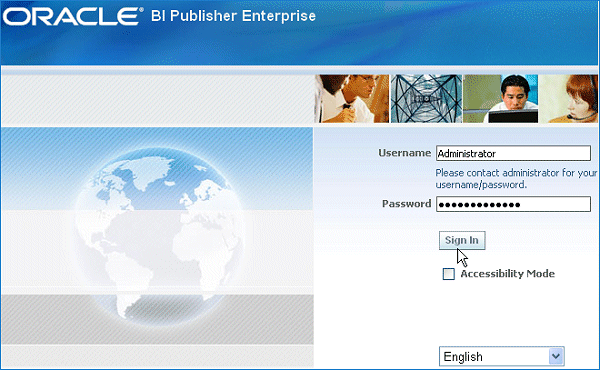
| Log in to BI Publisher as Administrator.
On Windows, you can invoke BI Publisher as follows:
|
| 2. | Navigate to My Folders > Learn (you created this folder in the "Getting Started..." OBE). Click Create a New Report. Enter Linked Report as the name of the report and click Create. The report is displayed in the Learn folder in BI Publisher. Click the Edit link under the name of the report to open the report in Edit mode. |
| 3. | In the General Settings section of the Report Properties, select demo from the Default Data Source drop-down list. Click the Save Click Data Model and click New to define the data source for this report. Note: You have defined the demo data source to connect to the OE schema of the Oracle Database. |
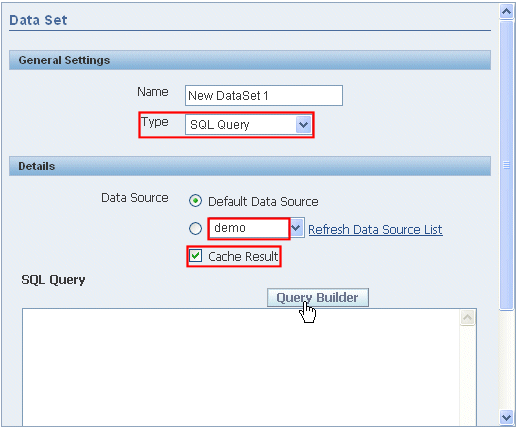
| 4. | In the Data Set screen that appears, ensure that SQL Query is selected as Type, and demo is selected as Data Source. Select the Cache Results check box, and click Query Builder to define the query. |
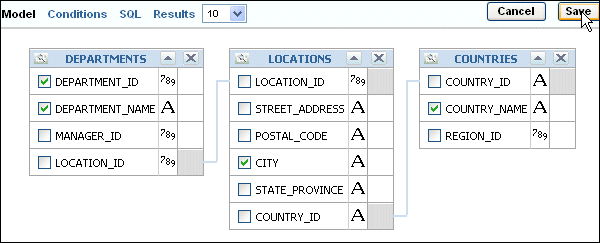
| 5. | The Query Builder screen appears. Ensure that HR is selected from the Schema drop-down list. This displays objects from HR schema on the left. Click the DEPARTMENTS, LOCATIONS, and COUNTRIES tables to add them to the Model canvas on the right. Note: When you define a connection to the OE schema, it also gives you access to HR schema. |
| 6. | Define joins between these tables as follows: Click the box beside the LOCATION_ID column in the DEPARTMENTS table. Similarly, click the box beside the LOCATION_ID column in the LOCATIONS table. These boxes when marked for joins turn light gray. Also, note that a fine line joining the tables appears in the Model canvas. Similarly, define another join between the LOCATIONS and COUNTRIES tables by using the COUNTRY_ID columns. After defining the joins, the screen appears as below: |
| 7. | Select the following columns from the tables (by selecting the check boxes beside the column names): -Select DEPARTMENT_ID and DEPARTMENT_NAME from the DEPARTMENTS table. -Select CITY from the LOCATIONS table. -Select COUNTRY_NAME from the COUNTRIES table. Click Save to save the query. Note: Do select the DEPARTMENT_ID column even if you do not want to display it in your report. Also, you can click View to view the XML data to see whether the query is rendering data to the report. |
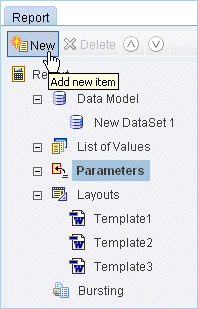
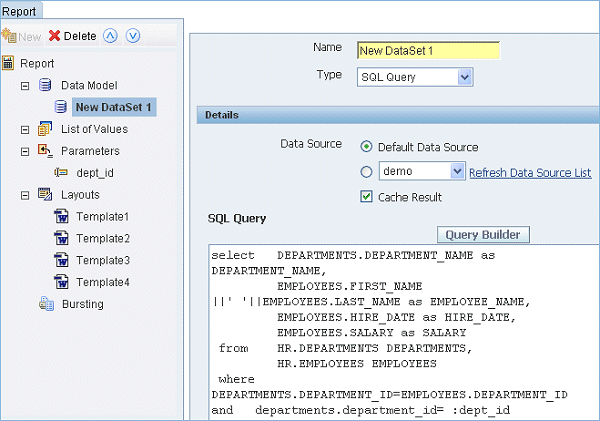
| 8. | Now edit the Based on Oracle DB report (the employee salary report by department) that you created in the "Getting Started..." OBE. Click Edit to open this report in edit mode. Click the Parameter node on the left and click New to create a parameter. Enter dept_id as the Identifier, select Integer from the Data Type drop-down list, and select Text from the Parameter Type drop-down list . Enter Department ID: as the Display Label. Click Save Now edit the data model to include this parameter, so that the query looks like below:
select DEPARTMENTS.DEPARTMENT_NAME as DEPARTMENT_NAME,
EMPLOYEES.FIRST_NAME ||' '||EMPLOYEES.LAST_NAME as EMPLOYEE_NAME, EMPLOYEES.HIRE_DATE as HIRE_DATE, EMPLOYEES.SALARY as SALARY from HR.DEPARTMENTS DEPARTMENTS, HR.EMPLOYEES EMPLOYEES where DEPARTMENTS.DEPARTMENT_ID=EMPLOYEES.DEPARTMENT_ID and departments.department_id = :dept_id |
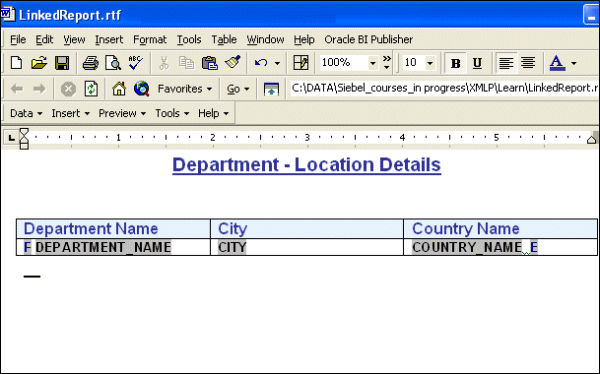
| 9. | In BI Publisher (Web), copy the URL for the Based on OracleDB report. Now open the LinkedReport.rtf template file provided with this OBE and save it with the same name on your system. Open this file in MS Word, which contains a simple table with Department Name, City, and Country Name columns: In MS Word, log in to BI Publisher as Administrator. In the Open Template window, ensure that BI Publisher is selected as the Workspace, and open Linked Report (which you created by navigating to the My Shared Folders > Learn folder). Select Preview Template as > PDF to view the report in PDF format: Note: Do not close the template file or the MS Word application. |
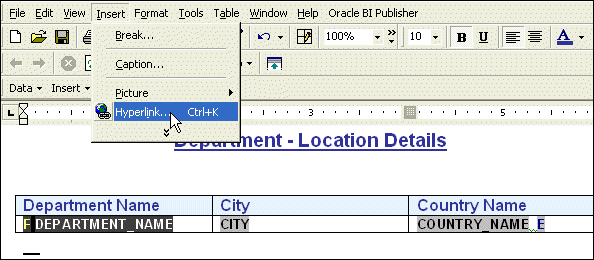
| 10. | Insert a hyperlink for the DEPARTMENT_NAME column in the table by using the Insert > Hyperlink menu option in MS Word. In the Insert Hyperlink window that appears, paste the URL of the Based on OracleDB report that you copied earlier, and add the following at the end: ?dept_id={DEPARTMENT_ID}.Click OK. Save the file. Preview the template as PDF,and ensure that the links are working fine. |
| 11. | MS Word has a known limitation on the length of the URL in a hyperlink. If the links are not working properly, then try the following: As a workaround for this issue, it is sometimes necessary to use an XSLT variable to hold a portion on the URL. Insert the following code into your RTF (this will not be shown in the report): <?variable:report_url;string(‘http://<host>:9704/xmlpserver/%7Eadministrator/Learn/Based+on+OracleDB/Based+on+OracleDB.xdo’)?> Then edit the hyperlink to use this variable as: {$report_url}?dept_id={DEPARTMENT_ID} See the screen below: |
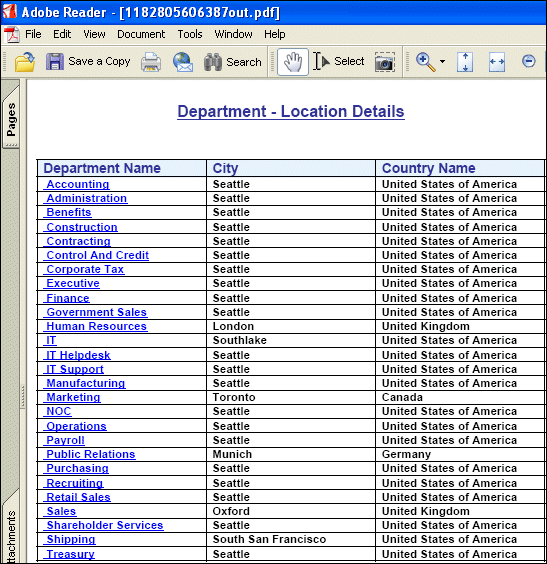
| 12. | Now preview the report as PDF and check the links. If you click the Accounting link, the employee salary report for this department is displayed in BI Publisher. Note that the value of Department ID is being passed as the parameter. You can also open the Linked Report directly in BI Publisher now and drill down on a department to view the employee salary report for that department . |
Oracle BI Publisher provides an online crosstab analyzer to analyze data. You can also analyze the data using the Analyzer for Excel, an add-in provided for MS Excel. In this topic, you will use the From BI Server report that you created in the OBE titled "Integration of Oracle Business Intelligence Publisher with Oracle Business Intelligence Enterprise Edition".
Using Online Analyzer
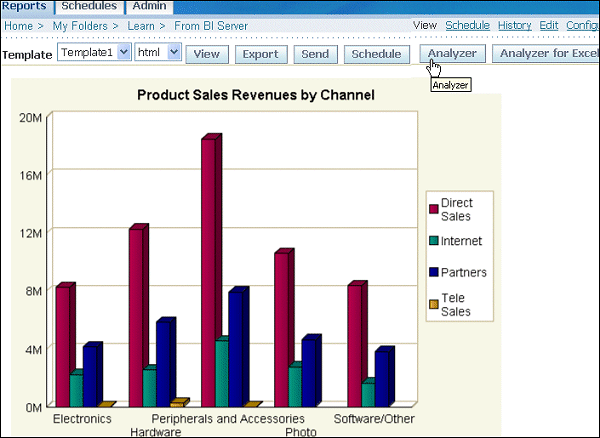
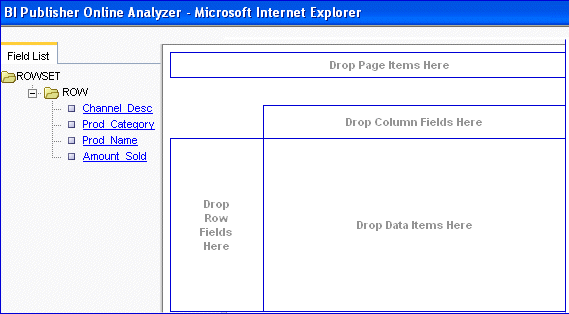
| 1. | if not logged in, log in to BI Publisher as Administrator. Navigate to My Folders > Learn and open the From BI Server report. (Click the View link below the name of the report to view the data.) Click Analyzer to open the online crosstab analyzer. The BI Publisher Online Analyzer screen appears. |
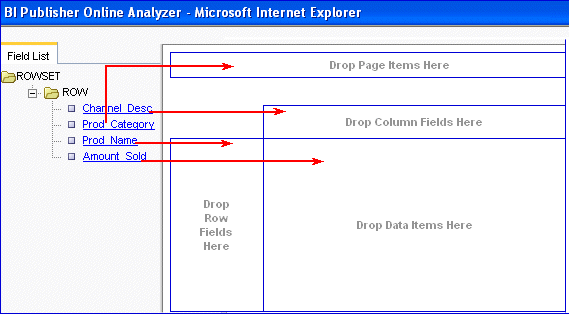
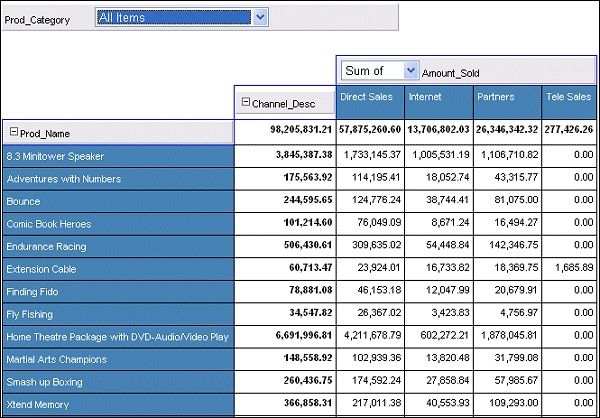
| 2. | On the BI Publisher Online Analyzer screen, from the ROWSET fields on the left drag the following to the areas as shown in the screenshot below: Prod Category to Page Items, Prod Name to Row Fields, Amount Sold to Data Items, and Channel Desc to Column Fields. The crosstab looks like this: (A portion of the screen is shown here, observe the structure of the crosstab) |
| 3. | This feature helps you to quickly create a pivot table and analyze the data in the report online. For example, you can see that most of product sales are good by Direct Sales. Distribution channels Internet and Partners have also reported good sales, whereas Tele Sales channel is not working well for most of the products, except for lightweight products such as Extension Cables, Cartridges, and so on. Close the online analyzer after your analysis is done. You can also change the structure of the crosstab according to the requirements of your data analysis and come up with some important business decisions or initiatives. |
Using the Analyzer for Excel
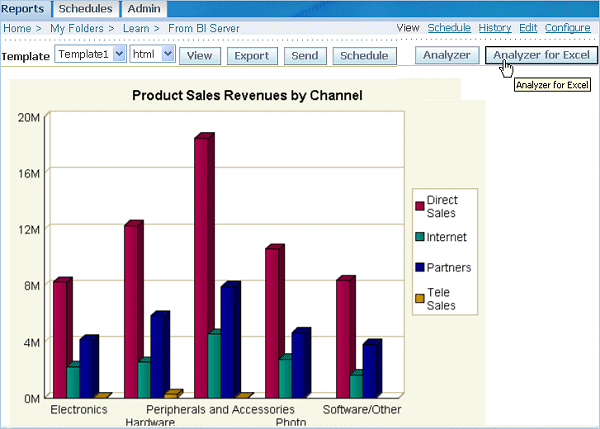
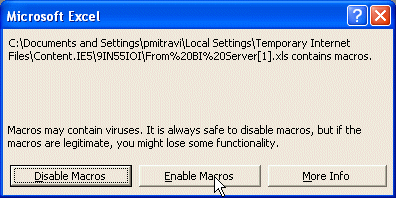
| 1. | Go back to view the From BI Server report , and click Analyzer for Excel. You will be prompted to save or open the <report name>.xls file. Click Open to open the file, and select Enable Macros from the Microsoft Excel dialog box.
Note: You must enable macros to use the Analyzer for Excel.
|
| 2. | The report data is rendered in the MS Excel application window and the Oracle BI Publisher menu appears on the Excel menu bar. Note that the data is the result of the report query with no template and with default filtering applied.
You can now manipulate the data as you want in Excel.
Note: If the report has parameters, the parameter names appear at the top of the worksheet, but you must log in to apply new parameter values.
|
| 3. | You must log in to enable all the menu options in the BI Publisher menu. Log in as Administrator from the BI Publisher menu in MS Excel.
Note: The first time you use the Analyzer for Excel, or if you do not have the latest version of Analyzer for Excel, you will be prompted to install the latest version.
|
| 4. | After logging in to BI Publisher, you can see that the various options in the BI Publisher menu are active. Using these options, you can perform tasks such as viewing the report online, seeing the parameters, updating a template, uploading a new template, and so on. Select the Oracle BI Publisher> Show Report Parameters menu option. This displays the available templates and updatable parameters (if the report has parameters) for the report in a toolbar. You can see that a worksheet is added with the name <report name>.html that shows the data of the report using the template selected. |
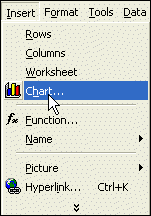
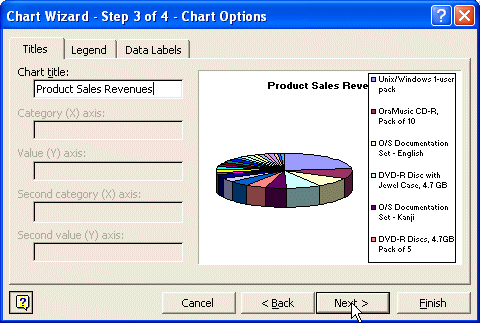
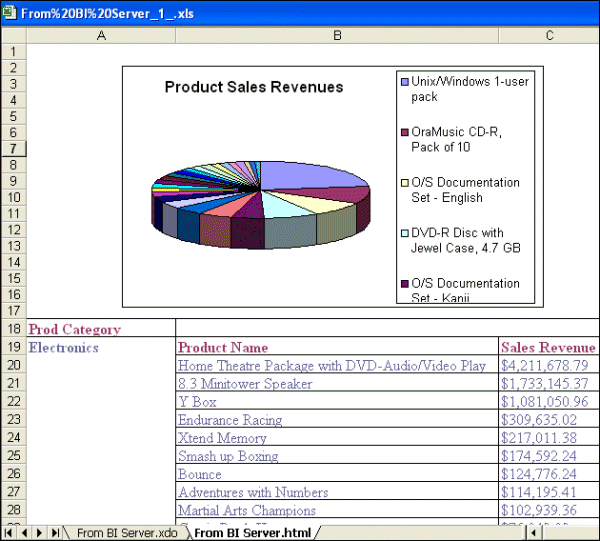
| 5. | You can make modifications in the Excel template to update the template or add it as a new Excel template. For example, you can add a chart in the From BI Server. html worksheet, and add it as a new template. Select the Insert > Chart menu option in Excel. In step 1, select Pie as the chart type and select the subtype as shown: Accept the default options in step 2. In step 3, change the chart title to Product Sales Revenues. In step 4, select the option to represent the chart in the From BI Server.html sheet (as shown below) , and clickFinish. Note that the chart is added in the sheet. Adjust the position of the chart so that it is placed at the top of the table in the From BI Server.html Excel sheet. The sheet looks like this: |
| 6. | Now you can add this as a new Excel template for the BI Publisher report. Select the Oracle BI Publisher > Add as New Excel Template menu option. Enter New Excel Template1 as the name and click OK. The following message is displayed: You can save this file with an appropriate name on your file system. Close the Excel application. |
| 7. | (If not logged in) Log in to BI Publisher as Administrator, and open the From BI Server report from My Folders > Learn in view mode. You can see that the Excel template you have uploaded is displayed in the Template drop-down list. Select the New Excel Template1 from the drop-down list. Click View. |
| 8. | Select the option to enable macros in MS Excel to open the report. Observe that the From BI Server.html sheet consists of the chart you added to the template before. Similarly, you can add multiple Excel templates in different formats or update an existing template format too. Note that you can also perform tasks such as viewing a report online, browsing for reports online, and so on by using the BI Publisher menu in Excel. |
In this topic, you configure some of the advanced settings for the reports and are also guided through the steps for report delivery configuration.
1. Go back to the View mode of the From BI Server report.
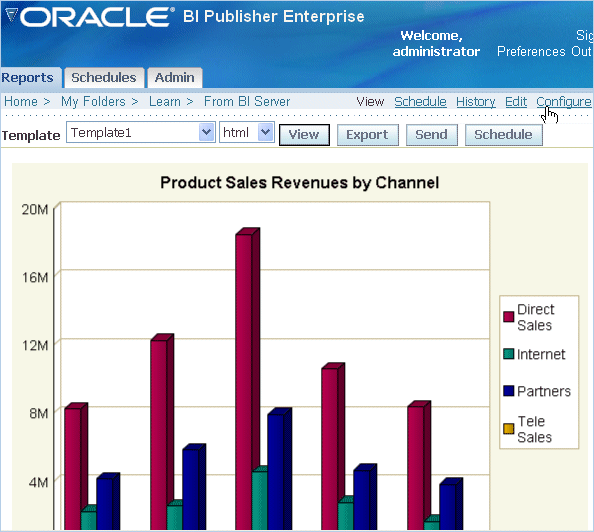
Click Configure.
2. This opens the Runtime Configuration page, observe the settings on this page.
In the PDF Output section of the page, do the following:
Set True as the value for the Enable PDF Security option.
Enter Oracle as the password for both Open Document password and Modify permission password.
Set True as the value for both Disable document modification and Disable Printing options. (See the screenshot below.)
Click Apply to apply the settings.
Scroll down and see other settings. Also, note that font settings can also be modified from the Font Mappingstabbed page.
3. Now go back to the View mode of the From BI Server report.
Select Template1 and PDF as the report viewing options. Click View.
4. You are prompted for a password to open the PDF document.
Enter Oracle as the password and click OK.
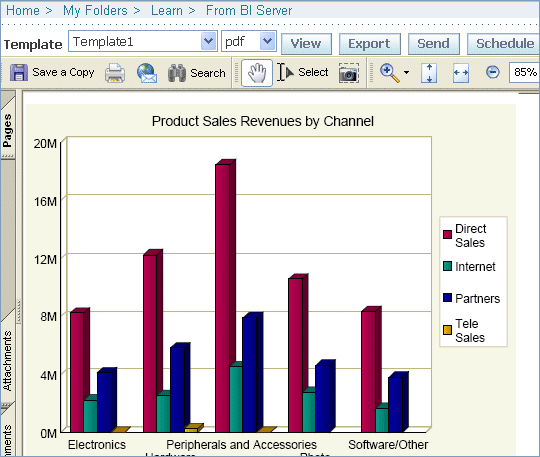
The report is now displayed as PDF:
If you have time, try out the other configuration settings.
Configuring PDF Security Options for a Report
Click Configure.
In the PDF Output section of the page, do the following:
Set True as the value for the Enable PDF Security option.
Enter Oracle as the password for both Open Document password and Modify permission password.
Set True as the value for both Disable document modification and Disable Printing options. (See the screenshot below.)
Click Apply to apply the settings.
Scroll down and see other settings. Also, note that font settings can also be modified from the Font Mappingstabbed page.
Select Template1 and PDF as the report viewing options. Click View.
Enter Oracle as the password and click OK.
The report is now displayed as PDF:
If you have time, try out the other configuration settings.
Delivery Configuration
The report delivery can be configured to reach destinations such as email server, FTP server, printer, and so on.
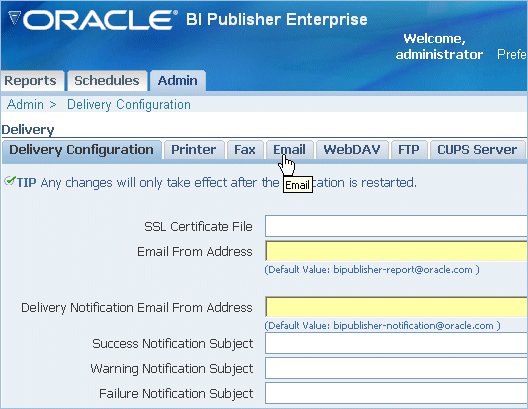
Email configuration is shown here (for the email configuration to work, you should have set up the ArGoSoft Mail Server Freeware as mentioned in the step 5 of the Prerequisites topic):
Email configuration is shown here (for the email configuration to work, you should have set up the ArGoSoft Mail Server Freeware as mentioned in the step 5 of the Prerequisites topic):
| 1. | Log in to BI Publisher as Administrator (if not logged in), and click the Admin tab to open the Admin page. |
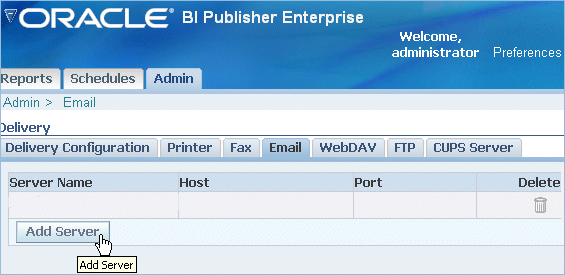
| 2. | Click Delivery Configuration. This opens the Delivery Configuration page. Observe the various delivery media that can be configured for the reports. Click the Email tab. On the Email configuration page, click Add Server. |
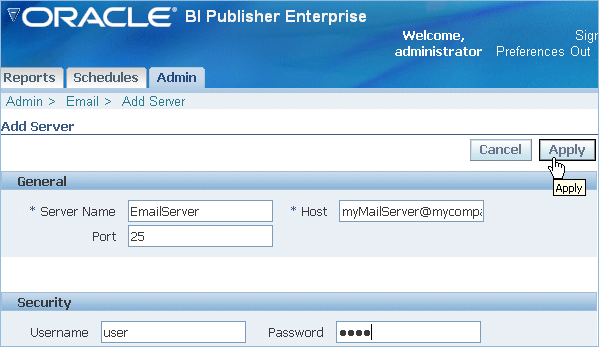
| 3. | On the Add Server page, enter Email Server as the Server Name; enter your host name (where you have installed the ArGo Soft mail server)—for example, myMailServer.myCompany.com; enter the port number for the mail server; and enter the username and password details. After entering all the appropriate details, click Apply. After the server is added, it appears on the Email page of Delivery Configuration. Note: You can add multiple email servers, and set one of them as the default mail server by selecting the Set as Default option. Also, you can configure FTP server, printer, and so on. |
In the "Getting Started..." OBE, you have configured the scheduler and have also scheduled a report. In this topic, you will schedule reports to use some more of the advanced features.
Note: It is mandatory to go through the "Getting Started..." OBE, and you should have configured the scheduler. Also, note that for the email to work, you should have set up the mail server as given in step 5 of the Prerequisites topic, and you should have done the email delivery configuration according to the previous topic.
In this topic, you schedule a report as an Email attachment:Scheduling a Report to Deliver As an Email AttachmentNote: It is mandatory to go through the "Getting Started..." OBE, and you should have configured the scheduler. Also, note that for the email to work, you should have set up the mail server as given in step 5 of the Prerequisites topic, and you should have done the email delivery configuration according to the previous topic.
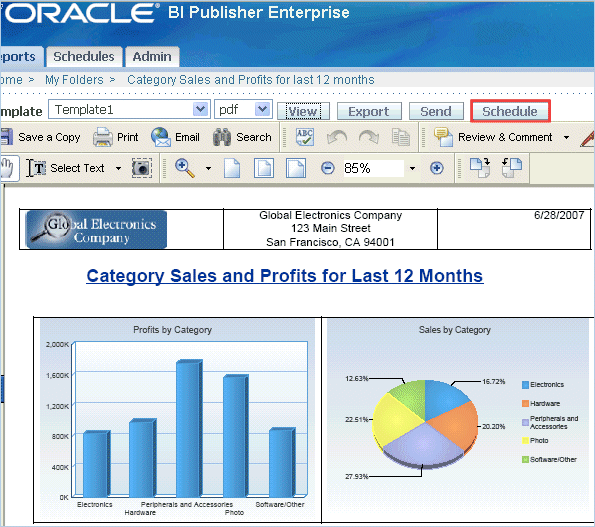
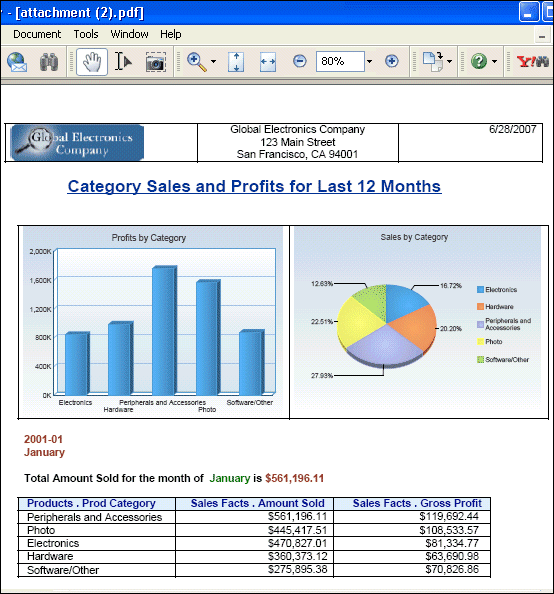
| 1. | (If not logged in) Log in to BI Publisher as Administrator, and open the Category Sales and Profits for last 12 months report in View mode from My Folders > Learn. (Select Template1 and PDF as the viewing options.) The report with the chart and table is displayed. Click Schedule to schedule this report. |
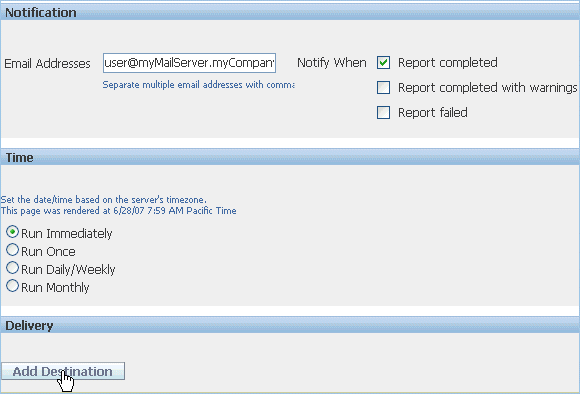
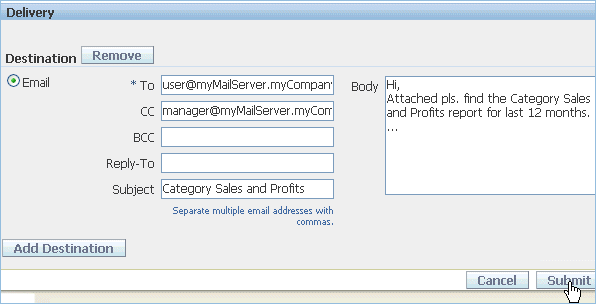
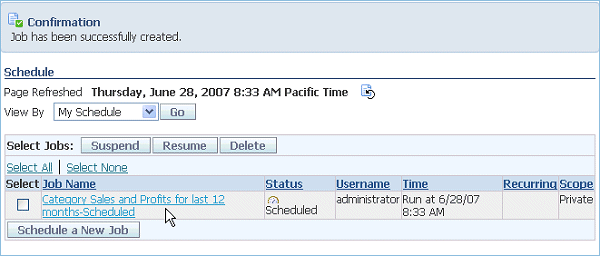
| 2. | On the Schedule Report page: Select Template1 as the template and PDF as the Format. Enter Category Sales and Profits for last 12 months -Scheduled as the Job Name. Scroll down to see other settings. In the Notification section, enter the mail ID of the user for whom you have configured the mail server (for example:user@myMailServer.myCompany.com), select the option to Notify when Report Completed,select the Run Immediately option, and click Add Destination in the Delivery section to add email as the destination. This displays all the destinations configured. Select Email option. This displays the screen with the email options with text fields to enter data such as To, CC, Subject, and Body of the email. Enter the appropriate data, and click Submit. This scheduled job is displayed on the Schedule page. Click the Schedules tab and click History to see whether the report is scheduled and delivered successfully. |
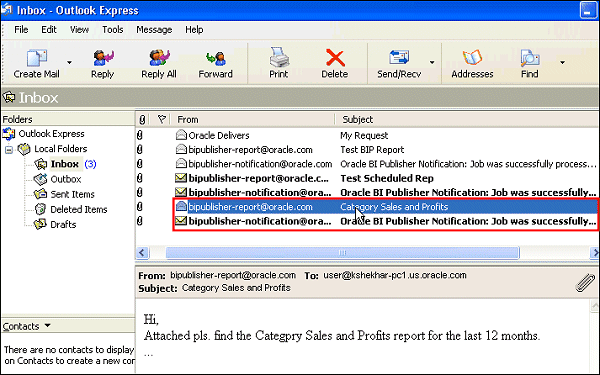
| 3. | Now open Outlook Express (or the mail client that you have configured) and log in to the mail as the user configured. When the report is successfully completed and delivered to the Inbox, you can see both the notification mail and the scheduled report. Open the attachment in the Category Sales and Profits mail to see the scheduled report. |
Bursting is an important and useful feature of BI Publisher, which enables you to split a single report based on a key in the report data and deliver the report based on a second key in the report data. Driven by the delivery key, you can apply a different template, output format, delivery method, and locale to each split segment of your report.
Following are some example scenarios where bursting can be implemented:
Following are some example scenarios where bursting can be implemented:
- Invoice generation and delivery based on customer-specific layouts and delivery preference
- Financial reporting to generate a master report of all cost centers, bursting out individual cost center reports to the appropriate manager
- Generation of payslips to all employees based on one extract and delivered via e-mail
In this topic, you are guided to create a report based on a SQL query, which contains the salary expenses of the direct reports of all the managers in the organization, and then you use this report to burst to a file location.
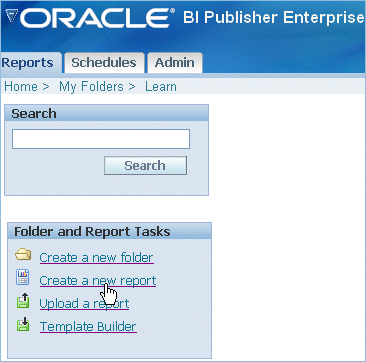
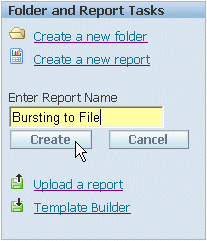
| 1. | (If not logged in) Log in to BI Publisher as Administrator. Navigate to My Folders > Learn, and click Create a new report. Enter Bursting to File as the name of the report, and click Create. |
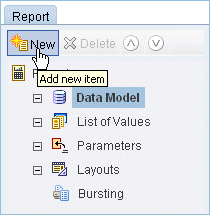
| 2. | The report appears on the BI Publisher page. Click the Edit link found below the name of the report to edit the report. The report is displayed in Edit mode. Click the Data Model node and then click New to define the data model for the report. |
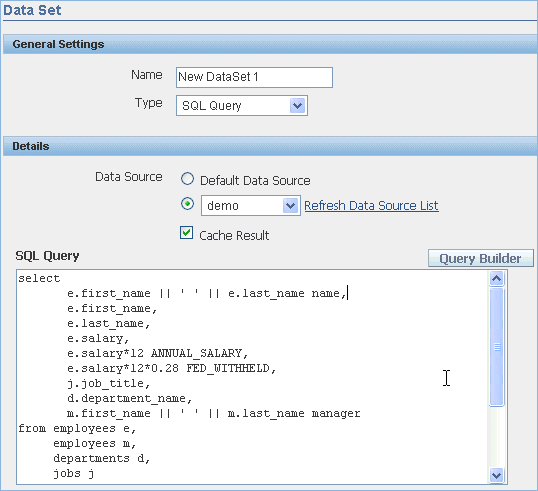
| 3. | On the Data Set screen that appears on the right, ensure that SQL Query is selected as Type, and demo is selected as Data Source. Select the Cache Results check box, copy and paste the following query in the SQL Query section:
select e.first_name || ' ' || e.last_name name, e.first_name, e.last_name, e.salary, e.salary*12 ANNUAL_SALARY, e.salary*12*0.28 FED_WITHHELD, j.job_title, d.department_name, m.first_name || ' ' || m.last_name manager from employees e, employees m, departments d, jobs j
where e.department_id = d.department_id and j.job_id = e.job_id and e.manager_id = m.employee_id and e.department_id = nvl(:dept,e.department_id) and e.employee_id = nvl(:emp,e.employee_id) order by e.department_id, e.manager_id
Click Save
The screen should look like this: Note: You can click View to see if the query is returning valid XML data. |
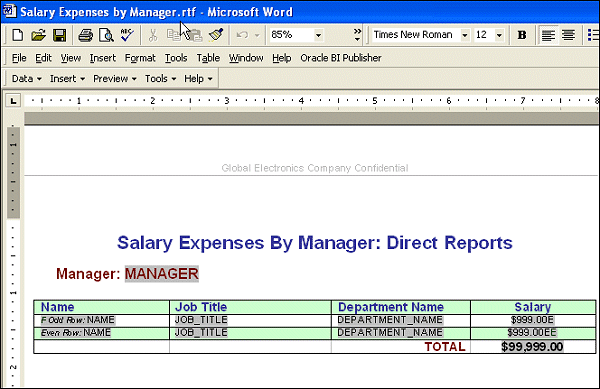
| 4. | Now open the Salary Expenses by Manager. RTF template file provided with this OBE. Save it on your local system with the same name, and open it in MS Word. The template file looks like the screenshot below: Now log in to BI Publisher from MS Word as Administrator. |
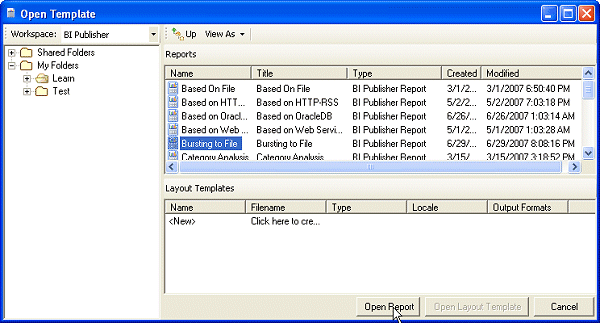
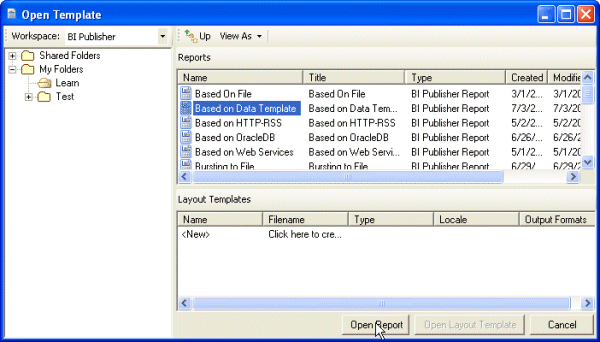
| 5. | In the Open Template window that appears, navigate to My Folders > Learn and open the Bursting to File report that you created. (Ensure that BI Publisher is selected as the Workspace.) Select Preview > PDF to view the report in PDF format: |
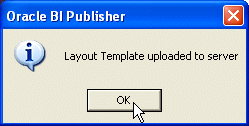
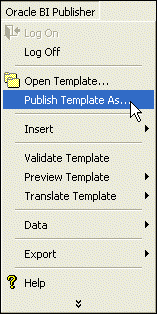
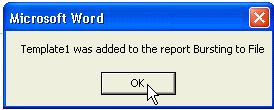
| 6. | Now select the Publish Template As... option from the Oracle BI Publisher menu in MS Word. Enter Template1 as the name and click OK. This uploads the template for the report, and displays the following message: |
| 7. | Now go back to BI Publisher and open the report , and open the Bursting to File report in Edit mode. On the Report Properties screen, click the Bursting node in the Report section on the left, to define bursting properties for the report. |
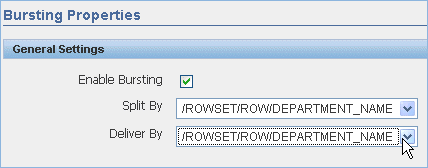
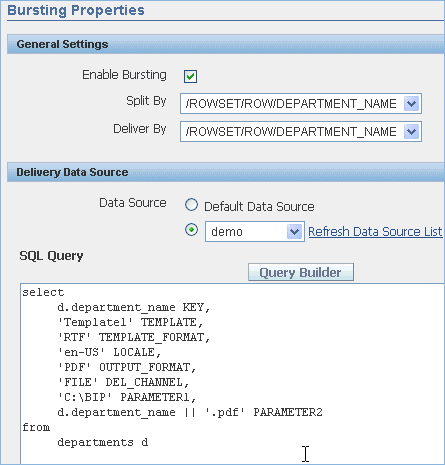
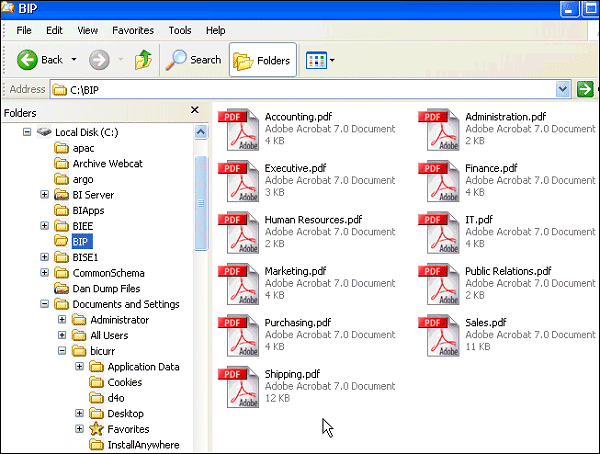
| 8. | This displays the the Bursting Properties screen on the right. In the General Properties section, select the Enable Bursting option, and then selectROWSET/ROW/DEPARTMENT_NAME from the Split By drop-down list and ROWSET/ROW/DEPARTMENT_NAMEfrom the Deliver By drop-down list. In the Delivery Data Source section, select demo as the Data Source, and add the following query in the SQL Query section: select d.department_name KEY, 'Template1' TEMPLATE, 'RTF' TEMPLATE_FORMAT, 'en-US' LOCALE, 'PDF' OUTPUT_FORMAT, 'FILE' DEL_CHANNEL, 'C:\BIP' PARAMETER1, d.department_name || '.pdf' PARAMETER2 from departments d Click Save The screen is shown below: Important Notes: Based on the SQL Query that you provide in the Delivery Data Source section on the Bursting Properties page, BI Publisher will build the delivery XML data set. For example, in the above query: department_name is the delivery key, (this should match your Split By field of the Bursting Properties) 'Template1' is the template to be used with the report, 'RTF' the template source format, 'en-US' - (US English) is the Locale, 'PDF' is the output format for the report, 'File' is the delivery channel with the path: C:\BIP as Parameter1. (This should be a folder on your local file system .Create a folder BIP in C:\ , or you can use any of the existing folders including the Temp folder too.) Parameter2 defines the file name format (this should match your Deliver By field, the delivery is done to files with names <department_name>.pdf). |
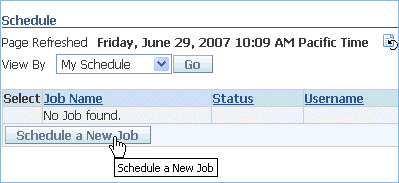
| 9. | Ensure that you saved the report after defining the Bursting Properties, and click Schedule to schedule this report to burst to the file location defined. This takes you to the Schedule page. Click Schedule a New Job to define the scheduling job. |
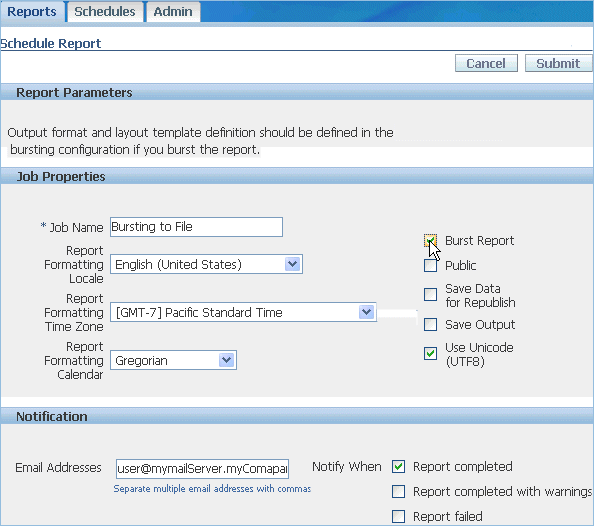
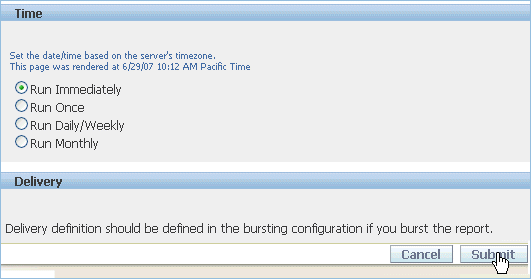
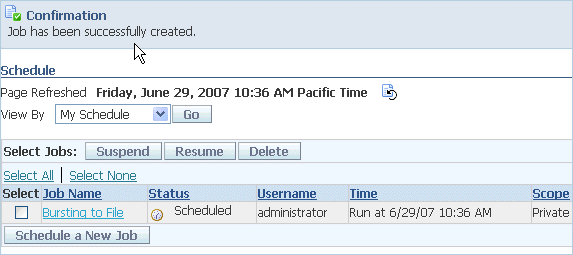
| 10. | On the Schedule Report page that appears, define the following: In the Job Properties section, select the Burst Report option, and in the Notification section you can optionally provide the email ID of the user to be notified when the report completes or fails (use the mail ID of the user that you have already configured—for example, user@myMailServer.myCompany.com). Scroll down to define the other options. Select the Run immediately option in the Time section and click Submit. This displays the message saying the job is successfully created. |
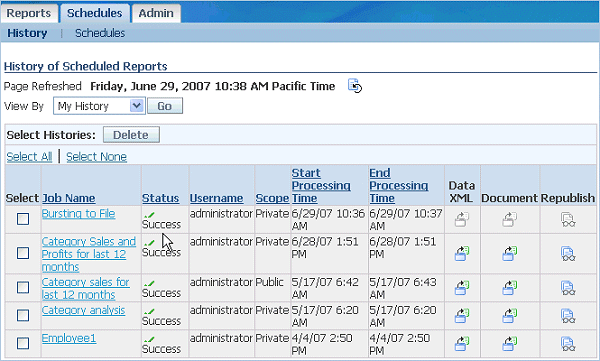
| 11 | Click the Schedules tab and then click History to see whether the schedule was run successfully. |
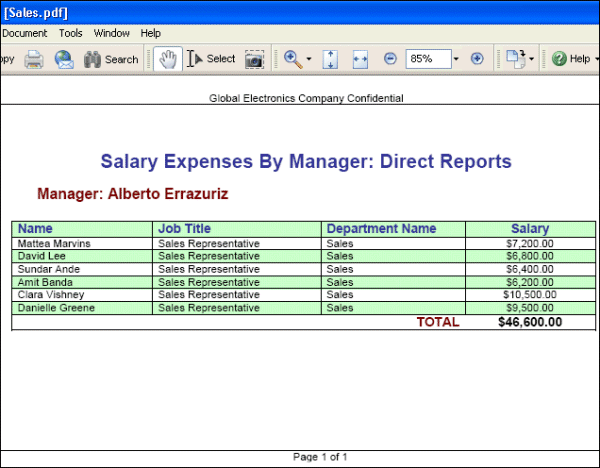
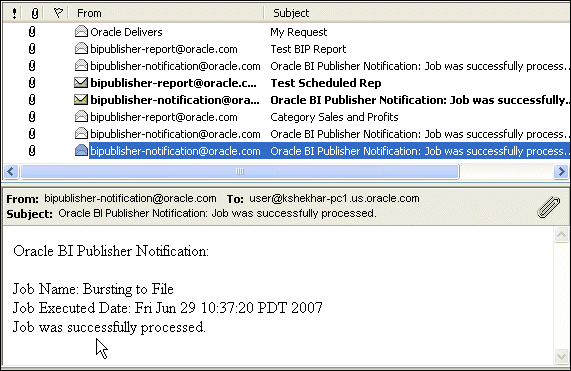
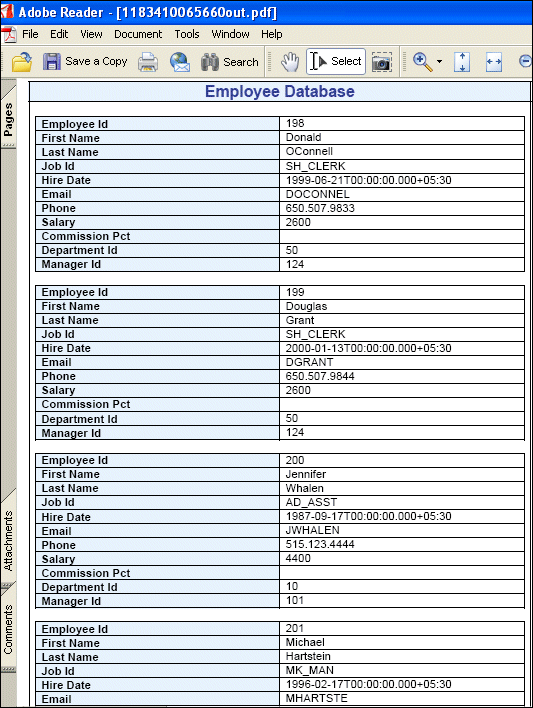
| 12. | Now go to the C:\BIP folder (the delivery destination folder you provided in the query). You can see that the PDF files, which have <Department Name>. PDF as the titles, are bursted to this file location. Open one of the files to see the report. For example, Sales. PDF report file looks like this: Note: You can also connect to the mail server as the configured user and you can see the notification sent when the job is scheduled successfully. |
Scheduling a Report to Burst to Email
You have already bursted a report to a file location; now you use the same report to burst it as email.
You have already bursted a report to a file location; now you use the same report to burst it as email.
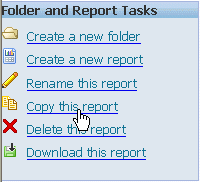
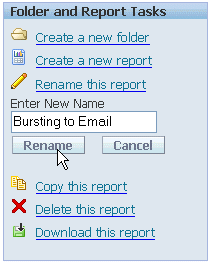
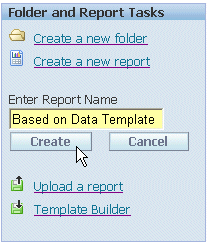
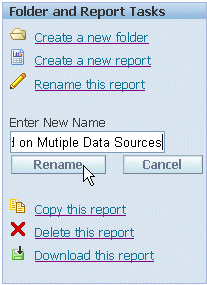
| 1. | The first step is to copy and rename the Bursting to File report. Ensure that you are logged in to BI Publisher as Administrator, and navigate to My Folders > Learn. Click the report icon Using the commands in the Folder and Report Tasks section, copy and paste the Bursting to File report. Rename the copied report as Bursting to Email. |
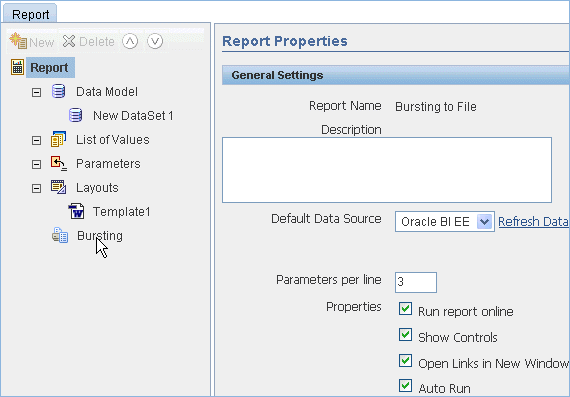
| 2. | Click the Edit link below the name of the report to edit this report. On the Report Properties screen, click the Bursting node in the Report section on the left, to define bursting properties for the report. |
| 3. | This displays the Bursting Properties screen on the right. In the General Properties section, select the Enable Bursting option, and then selectROWSET/ROW/DEPARTMENT_NAME from the Split By drop-down list and ROWSET/ROW/DEPARTMENT_NAMEfrom the Deliver By drop-down list. In the Delivery Data Source section, select demo as the Data Source, and add the following query in the SQL Query section:
select d.department_name KEY,
'Template1' TEMPLATE, 'RTF' TEMPLATE_FORMAT, 'en-US' LOCALE, 'PDF' OUTPUT_FORMAT, 'EMAIL' DEL_CHANNEL, 'user@myMailServer.myCompany.com' PARAMETER1, 'user1@myMailServer.myCompany.com' PARAMETER2, 'bipublisher-report@oracle.com' PARAMETER3, 'SUBJECT: Bursting to Email Test' PARAMETER4, 'BODY: Test Report Body' PARAMETER5, 'true' PARAMETER6, 'replyto@nowhere.com' PARAMETER7 from departments d
(See the screen below)
Click Save
The parameter mapping for bursting to email is shown below: Note: Parameter 6 must be set to true if the delivery format selected is PDF. |
| 4. | Click Schedule to schedule this report, and click Schedule a New Job on the Schedule page, to define the scheduling job. |
| 5. | On the Schedule Report page, define the following: In the Job Properties section, select the Burst Report option, and in the Notification section you can optionally provide the email ID of the user to be notified. Scroll down to define the other options. Select the Run immediately option in the Time section and click Submit. This displays the message saying the job is successfully created. |
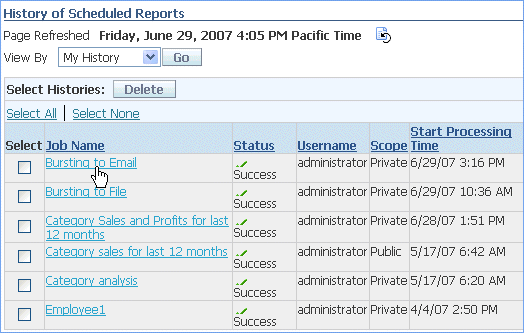
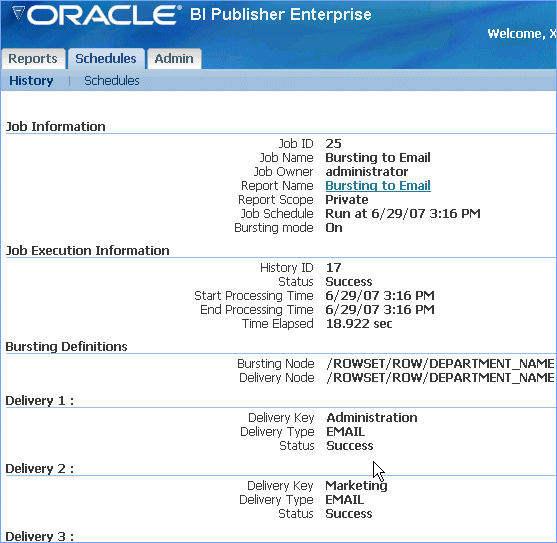
| 6. | Click the Schedules tab and click History to see whether the schedule was run successfully. Click the Bursting to Email job to see the details. You can also check the mail for the notification and files. |
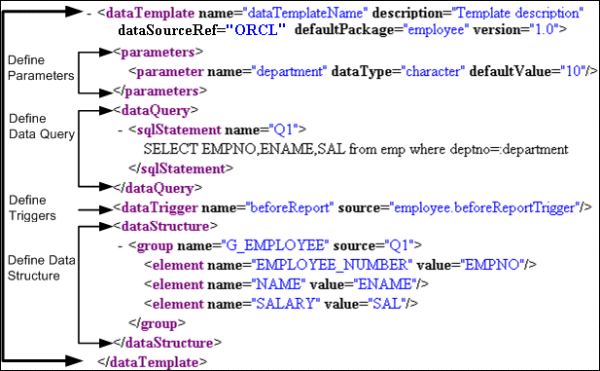
Another salient feature of the BI Publisher data engine is that it enables you to rapidly generate any kind of XML data structure against any database in a scalable and efficient manner. The data template is the method by which you communicate your request for data to the data engine. It is an XML document whose elements collectively define how the data engine will process the template to generate the XML.
The data template is an XML document that consists of four basic sections: define parameters, define triggers, define data query, and define data structure. An example of this structure is illustrated on the following screen:
The data template is an XML document that consists of four basic sections: define parameters, define triggers, define data query, and define data structure. An example of this structure is illustrated on the following screen:
In this topic, you create a report by defining a simple data template and structure for the XML data.
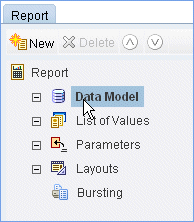
| 1. | Ensure that you are logged in to BI Publisher as Administrator, and navigate to My Folders > Learn. Click Create a new report. Enter Based on Data Template as the name of the report and click Create. Click the Edit link below the name of the report created to edit the report. On the Report Properties page that appears, click the Data Model node on the left and click New to define the data model for the report. |
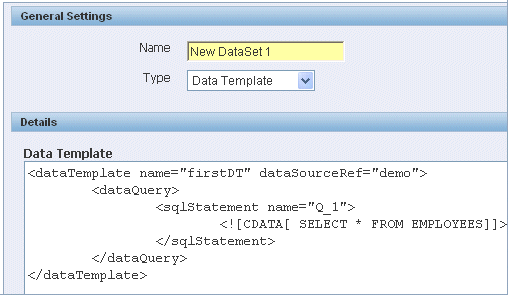
| 2. | On the Data Set screen that appears on the right, select Data Template from the Type drop-down list in theGeneral Settings section. This displays the basic structure for the data template. Copy this code in the Data Template section:
<dataTemplate name="firstDT" dataSourceRef="demo">
</dataTemplate>
(See the screenshot below.)
Click Save
Note: The data source reference defined in the code should point to your database connection. In this case, it isdemo, the connection to the OE/HR schemas of the database.
|
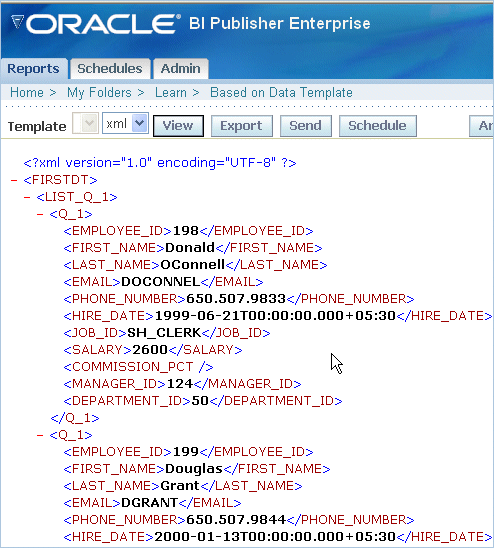
| 3. | Click View to see the XML data to check whether the data is rendered to the report. It should look like this: |
| 4. | Now structure the XML in the data template that you have defined. Click Edit to edit the data model, and paste the following code in the Data Template section.
<dataTemplate name="firstDT" dataSourceRef="demo">
</dataTemplate>
See the screenshot below:
Do not forget to save the changes each time you modify a report. Click Save |
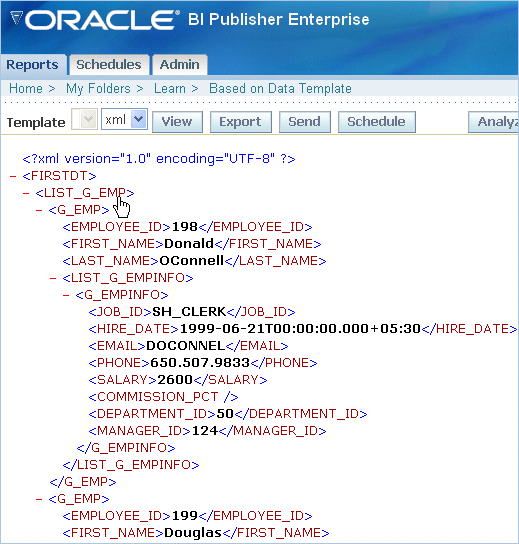
| 5. | View the XML data of the report, and observe the changes in the structure. |
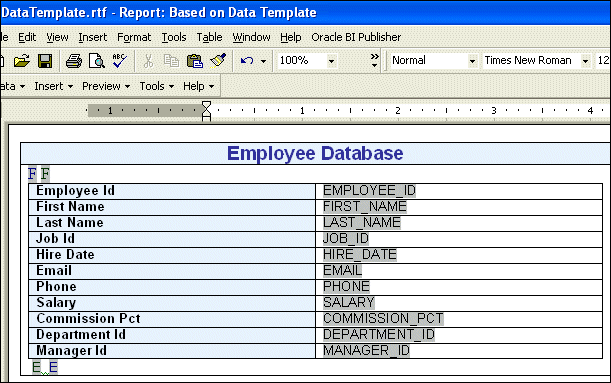
| 6. | Like other BI Publisher reports, you can also create the RTF template file in MS Word for the Based on Data Template report. However, Data Template.rtf is provided with this OBE to be used with this report. Open this template file in MS Word. Log in to BI Publisher as Administrator from MS Word, and open the Based on Data Template report. Select Preview > PDF to preview the report in PDF. Publish the template as Template1 for the report. Note: A simple data template report is created in this exercise, but you can define a complex data template with parameters and triggers. |
BI Publisher enables you to create a report from multiple data sources. This feature is very useful because you can pull the data into a single report based on multiple data sources—for example, on the report which shows the employee details, you may also want to show the stock information for your organization. In this topic, you will create a single report that uses the data template report you created in the previous topic (Based on Data Template), and also the report that you created based on Web services (Based on Web Services) in the "Getting Started..." OBE.
| 1. | Click the report icon Using the commands in the Folder and Report Tasks section, copy the Based on Data Template report. Rename the copied report as Based on Multiple Data Sources. |
| 2. | Click Edit to edit the Data Model for the report. Click Data Model in the Report section on the left and click New to add another data source to the report (note that the report already has a data set defined, which is based on the data template.) Click New Data Set2 (created above); this opens the Data Set page on the right. Select Web Service from the Type drop-down list. Enter http://www.webservicex.net/stockquote.asmx?WSDL in the WSDL URL field, and GetQuote as the method name. Click the Save |
| 3. | Create a parameter Quote with the following properties:
Also, click the New Data Set2 data model, and add the Quote parameter that you have created to this data set. Click the Save The screen looks like this: |
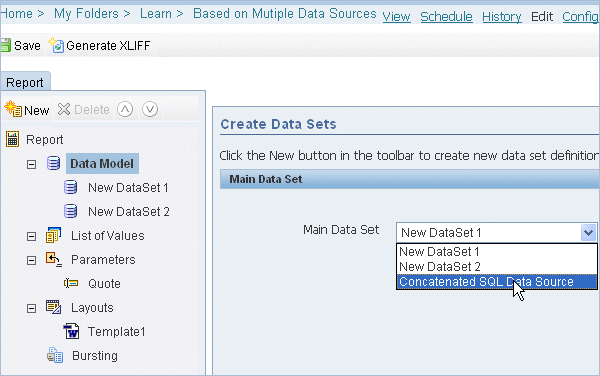
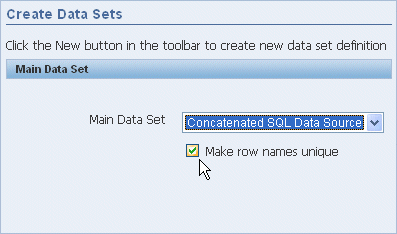
| 4. | Click the Data Model node, and select Concatenated SQL Data Source from the Main Data Set drop-down list. Select the Make row names unique check box, and click Save |
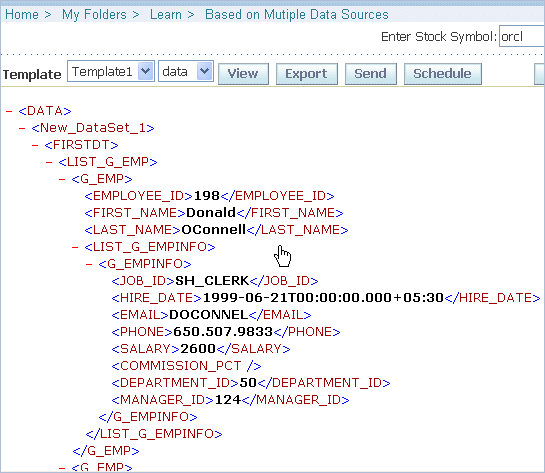
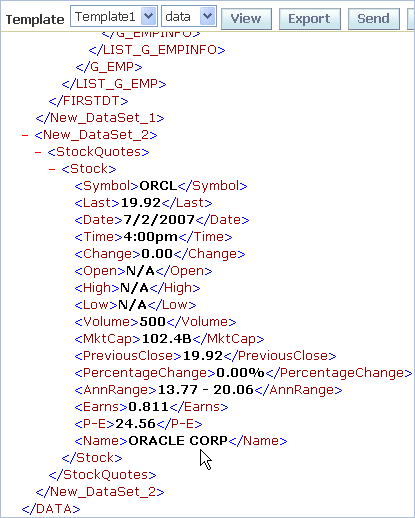
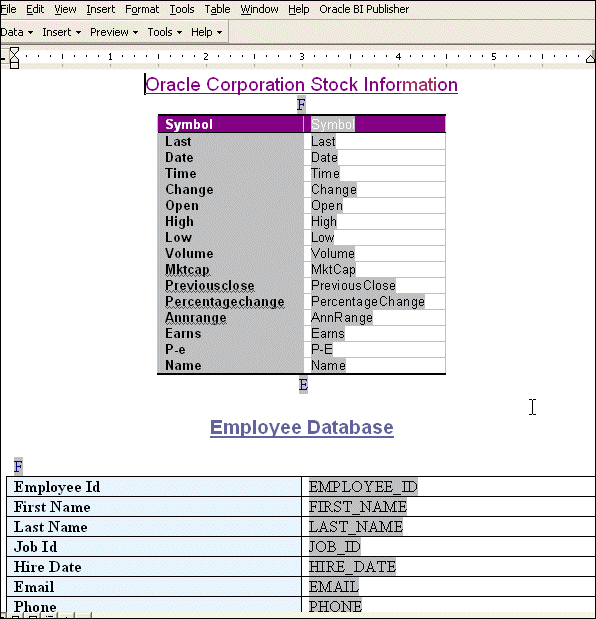
| 5. | Click View to see whether the XML data is rendered to the report. Scroll down to see the entire XML data. Note that Oracle Corporation's stock quote from the Web Service data source is displayed at the end after the employee data. Note: Like other BI Publisher reports, you can create and publish the templates for this report in MS Word by using BI Publisher Desktop. A sample template is shown below: |
In this tutorial, you learned how to:
| Create a report with a hyperlink to another report | ||
| Analyze the data by using online and Excel analyzers | ||
| Configure advanced options such as email and PDF security for the reports | ||
| Schedule a report to deliver as an email attachment | ||
| Schedule a report to burst to a file location and email | ||
| Create a report from a data template | ||
| Create a report from multiple data sources | ||


